Napa County Midyear Report: The First Half of 2026
More homes sold across the valley, average prices eased, and the story shifts from one town to the next.
Our Bi-Annual Market Report is out, comparing the first half of 2026 with the same stretch of 2025 across the communities we serve. The headline is a busier but more measured market. More homes sold across the county, average sold prices softened, and homes took longer to sell than they did a year ago. Here is what the numbers show, and how our valley fits into the wider California picture.
You can page through the complete report, community by community, here: View the full 2026 Bi-Annual Market Report.
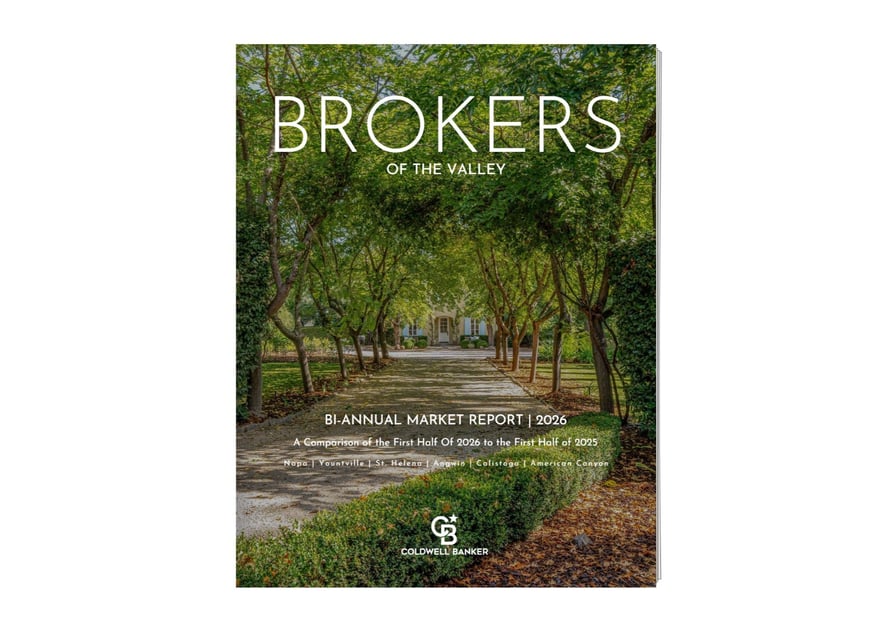
Our 2026 Bi-Annual Market Report. Click the cover to open the full flipbook.
The County at a Glance
Napa County, first half of 2026 vs 2025
Homes Sold
582
▲ 16% year over year
Avg. Sold Price
$1,099,169
▼ 9% year over year
Avg. Price per Sq. Ft.
$574
▼ 4% year over year
Avg. Days on Market
91
▲ 20% year over year
Source: BAREIS MLS, January through June, 2026 compared to 2025. Statistics generated 7/8/2026.
Sales volume rose while average prices pulled back, and homes took longer to sell than they did a year ago, now about three months on average. One important note on that price figure: an average is shaped by which homes happen to sell in a given period, so a 9 percent dip in the county average does not mean every Napa County home lost 9 percent of its value. It often reflects a change in the mix and price range of the homes that closed. For sellers, that makes pricing to today's market more important than ever.
The Luxury Segment
A million dollars and above
In the county's million-plus segment, activity remained essentially unchanged, with 198 homes sold in the first half of 2026 compared with 197 a year earlier. The average sold price eased about 3 percent to $2,044,105, and the average price per square foot slipped 1 percent to $787. The clearest shift came in time on market, where higher-end homes took an average of 105 days to sell, up from 79, a 33 percent increase.
Community by Community
Where each town landed
The county average tells one story, but each community wrote its own. St. Helena stood out, pairing more sales with a rising average price, while the City of Napa saw a jump in sales alongside a softer average. Calistoga posted the largest gain in homes sold among the communities in the report, and the smaller markets of Angwin and Yountville moved on very low transaction counts, where a handful of sales can swing the percentages.
Community | Homes Sold | Avg. Sold Price | Avg. Days |
|---|---|---|---|
City of Napa | 417 ▲15% | $1,022,535 ▼15% | 92 ▲33% |
Yountville | 17 ▼11% | $1,017,618 ▲3% | 77 ▼9% |
St. Helena | 48 ▲20% | $2,274,967 ▲16% | 98 0% |
Calistoga | 36 ▲38% | $1,074,769 ▼6% | 120 ▼6% |
American Canyon | 46 ▲12% | $583,000 ▼3% | 47 ▲34% |
Angwin | 5 ▼38% | $956,268 ▼15% | 118 ▼32% |
Source: BAREIS MLS, January through June, 2026 compared to 2025. Figures are averages and reflect closed sales in each community.
The Statewide Picture
How Napa fits into California
For wider context, the California Association of REALTORS® reported that statewide home sales rebounded in June to a seasonally adjusted annualized rate of 279,880, up 6 percent from a year earlier, while the statewide median price held above $900,000 for a third straight month at $904,640. As C.A.R. President Tamara Suminski put it, "California's housing market ended the first half of the year on stronger footing." One caveat on comparison: the C.A.R. figures cover June alone and count only existing single family detached homes, while our report spans the full first half of the year across a broader set of residential sales, so the two are best read as context for one another rather than a direct match.
Napa County drew particular attention in the June report. Its closed sales rose 59.6 percent from a year earlier, the third largest annual increase among the 53 counties C.A.R. tracks, yet it also recorded the state's steepest annual decline in median price, down 17.3 percent for the month. C.A.R. cautions that in smaller counties like ours, swings this large are often influenced by limited transaction volumes and shifts in the mix of homes sold, rather than a broad change in underlying home values. Our own first-half figures are consistent with that picture of a more active market, though it is worth remembering the two reports measure different things: ours reports a six-month average sold price, while C.A.R. reports a single-month median.
On Financing
Where rates stood in June
Mortgage rates remained a central factor through the first half of the year. The 30-year fixed rate averaged 6.49 percent in June, down from 6.82 percent a year earlier, according to C.A.R.'s calculations based on Freddie Mac survey data. Our report's mortgage contributor, Hilda Hensley of Hensley Mortgage Group, describes a resilient market in which well-prepared buyers are using tools like temporary rate buydowns, adjustable-rate mortgages, and down payment assistance to improve affordability and find opportunities.
Numbers tell the market. Local knowledge tells your story.
Averages describe the valley as a whole, but every home, street, and price point moves a little differently. If you are weighing a move and want to know what these trends mean for your specific property or your search, our team is here to walk through it with you.
This content was created with the assistance of artificial intelligence and reviewed by the Coldwell Banker® Brokers of the Valley marketing team. Local market statistics are sourced from BAREIS MLS and reflect the first half of 2026 compared with the first half of 2025. Information has not been verified, is not guaranteed, and is subject to change. ©2026 Bay Area Real Estate Information Services, Inc. All rights reserved. Statistics generated 7/8/2026. Statewide data and quotations are courtesy of the California Association of REALTORS® June 2026 Sales and Price Report. Mortgage rate figures are based on Freddie Mac survey data. ©2023-2026 Coldwell Banker Real Estate LLC. All Rights Reserved. Coldwell Banker and the Coldwell Banker logo are trademarks of Coldwell Banker Real Estate LLC. The Coldwell Banker® System is comprised of company owned offices which are owned by a subsidiary of Anywhere Advisors LLC and franchised offices which are independently owned and operated. The Coldwell Banker System fully supports the principles of the Fair Housing Act and the Equal Opportunity Act. Listing information is deemed reliable but is not guaranteed.