The commercial real estate market will surprisingly close with a bang in 2021 given the historic strong demand for multifamily and industrial space and the resiliency of brick-and-mortars in serving consumer demand off-premises. The strong growth in these sectors made up for the weak and tenuous recovery in the office market. The year 2021 is also poised to be the strongest year in terms of investment acquisitions, surpassing the peak sales volume of 2006 and the pre-pandemic level.
In 2022, sustained household formation, strong consumer spending amid slower inflation and sustained wage growth, continuing re-entry to the office even if mostly on a hybrid schedule, and the expansion of construction and investments in secondary/tertiary markets will drive leasing, construction, and sales. Interest rates are on a course to increase with the Federal Reserve winding down its $120 billion monthly asset purchases and eyeing three federal funds rate hikes. However, interest rates will still be low compared to the pre-pandemic level and even if the T-note hits 2.5% by end of 2022, this will still be lower than the average rate of nearly 3% in 2018. Strong economic property market fundamentals will drive the growth in net operating income, especially in the multifamily and industrial market, and will continue to attract equity capital and sustain price appreciation.
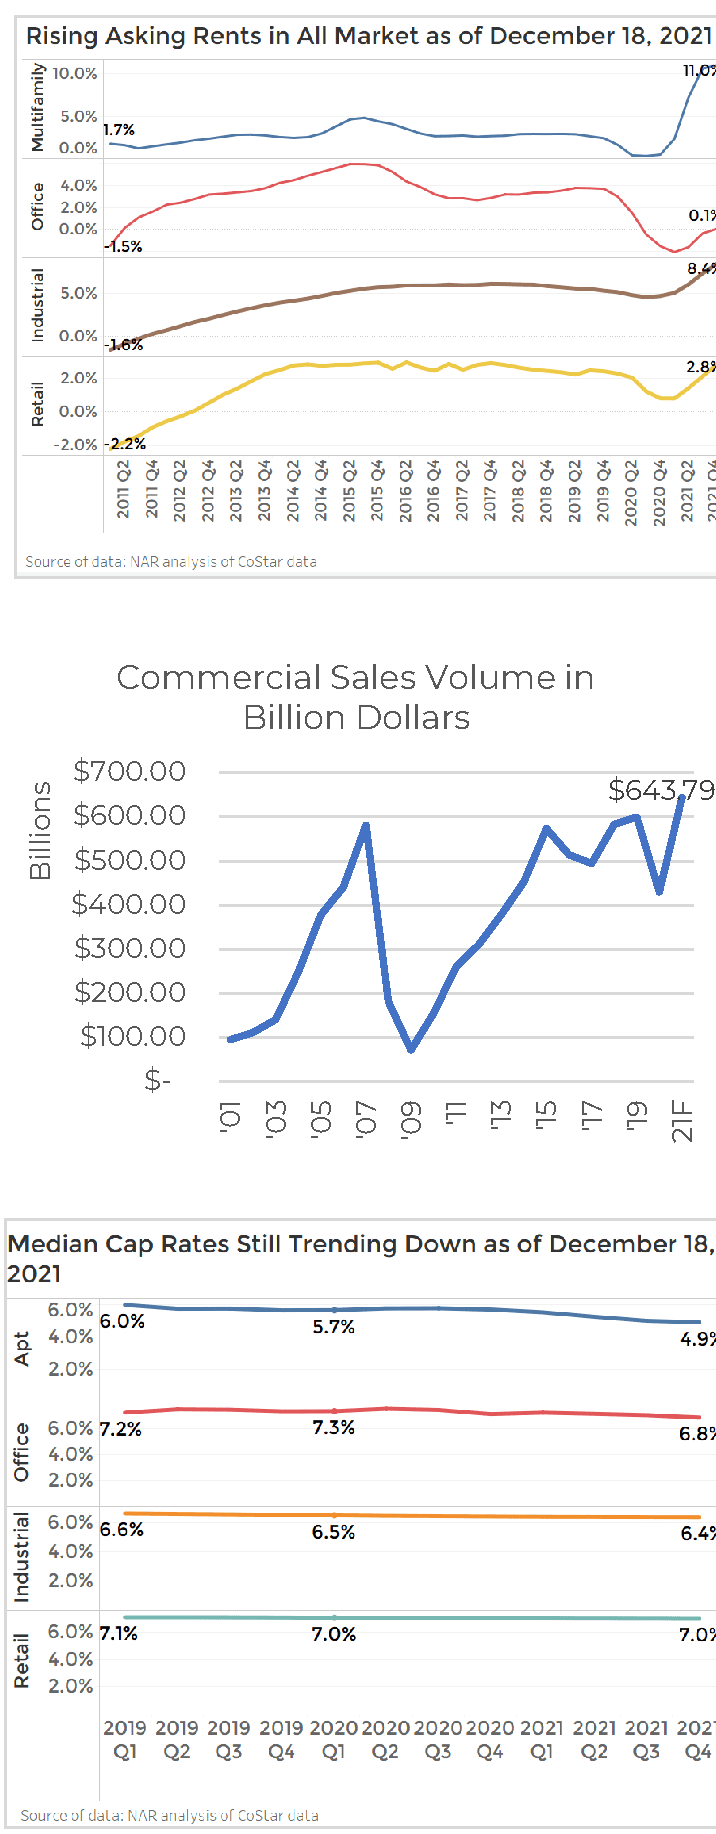
With improving market fundamentals, investor acquisitions of multifamily, office, retail, and industrial properties of at least $2.5 million totaled $523 billion in the first ten months of the year. NAR expects the full-year level of acquisitions to hit nearly $645 billion, surpassing the prior peak level of acquisitions in 2006 of $581 billion.
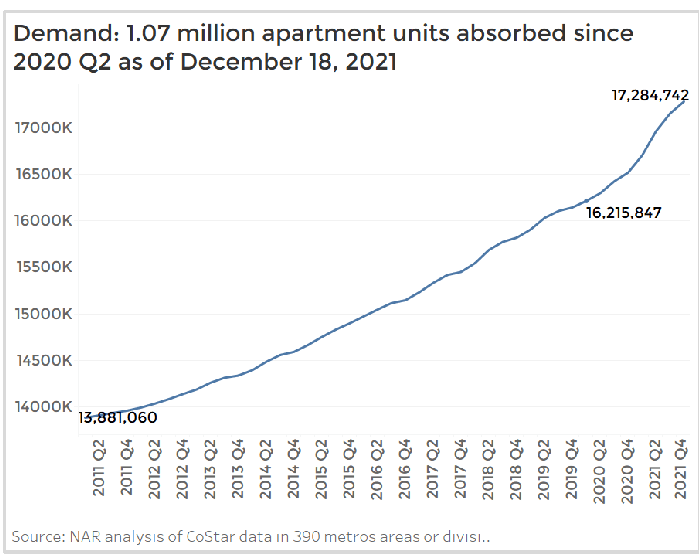
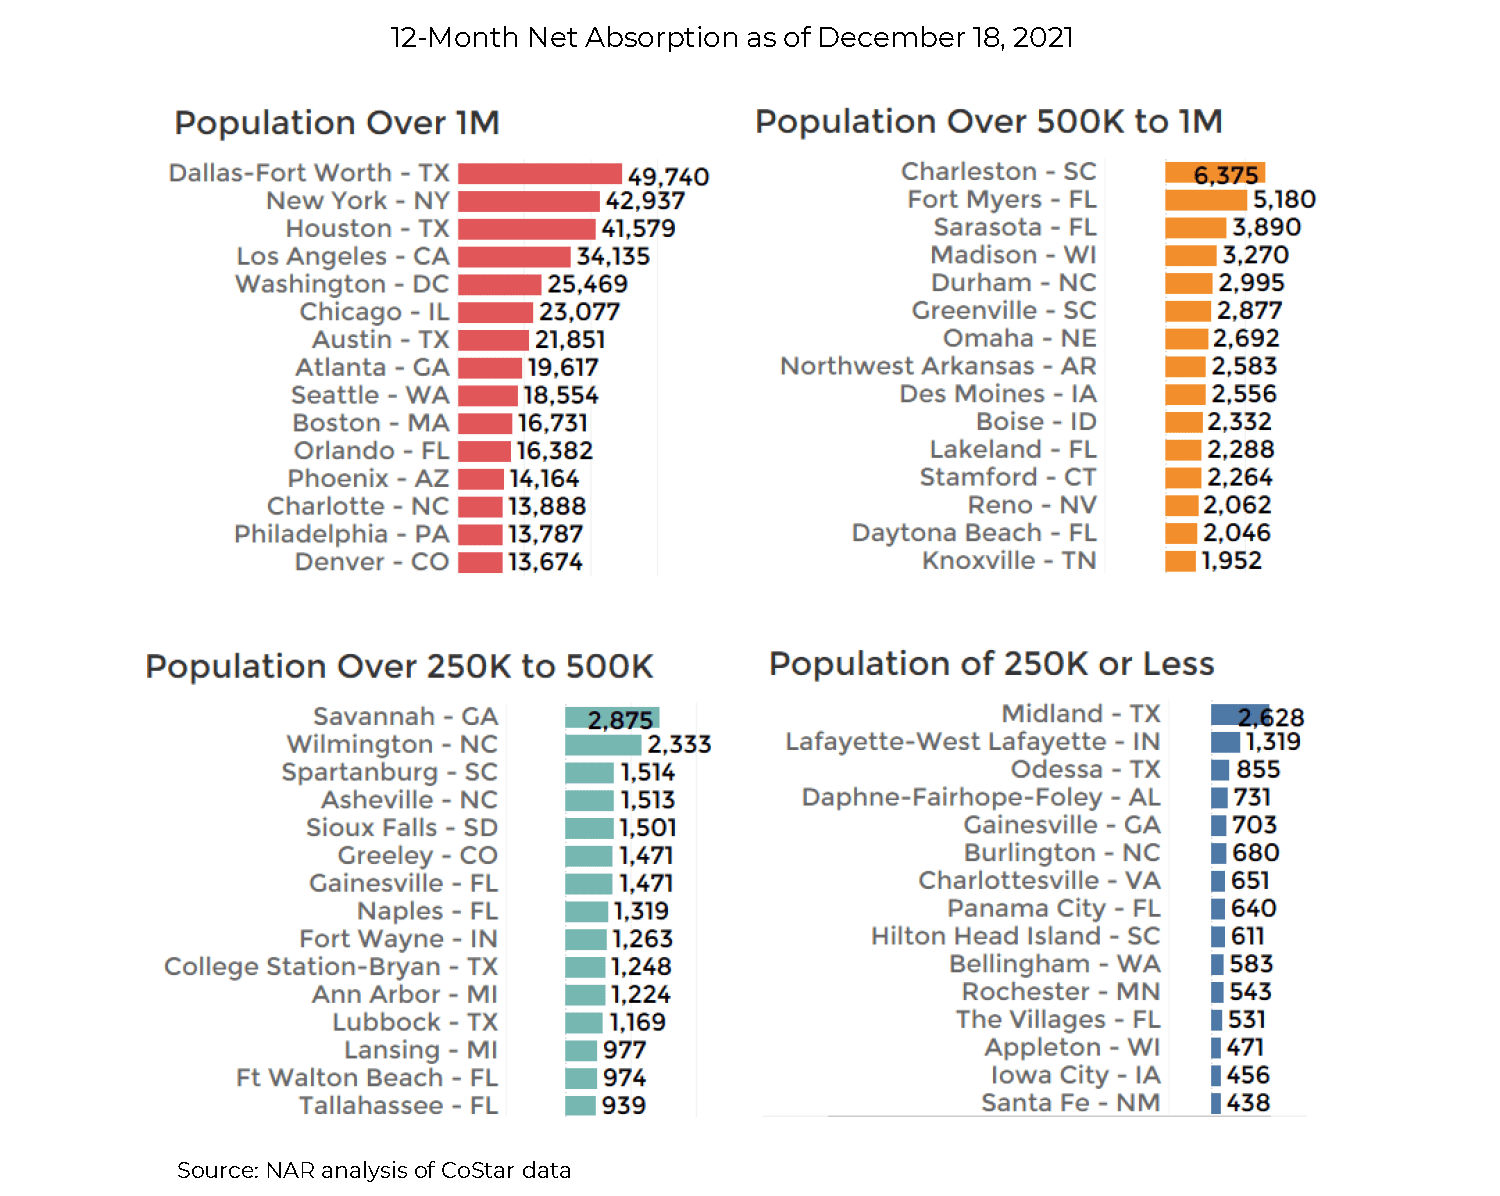
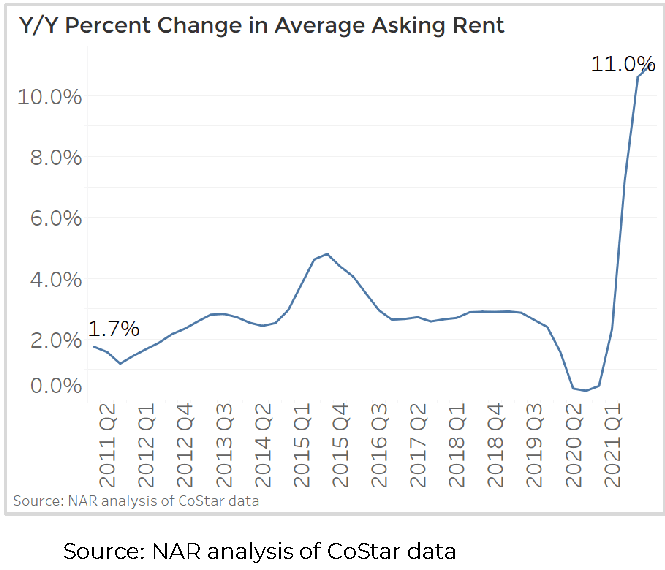
The multifamily market had a historic year, with 1.07 million units absorbed since the pandemic. The vacancy rate hit a record-low of 4.5% as of December 18 while the median asking rent growth hit a record high of 11% year-over-year. Rental demand soared amid the recovery in household formation and with home prices rising at a double-digit pace. Rental demand has increased across primary and secondary markets, with renters returning to the major metro areas of New York, Washington DC, Boston, Chicago, San Francisco, and Los Angeles. However, metro areas in the Sunbelt markets had the largest increase in net demand, led by Dallas, Houston, Charleston, Wilmington, Savannah, and several Florida metro areas.
With sustained demand for online shopping, the industrial property market also had a record year, with nearly 700 million square feet of space absorbed since the pandemic and with rents soaring to a historic high of 8.4% as vacancy fell to an all-time low of 4.1%.
The retail brick-and-mortars managed to survive broadly unscathed, except malls. Since 2020 Q2, 47.9 million square feet of space was absorbed, compared to just 29 million square feet of retail space absorbed in the 12 months before the pandemic hit. Malls saw a decline in occupancy, but that was offset by the positive net absorption from neighborhood centers, strip centers, and free-standing/single-tenant stores.
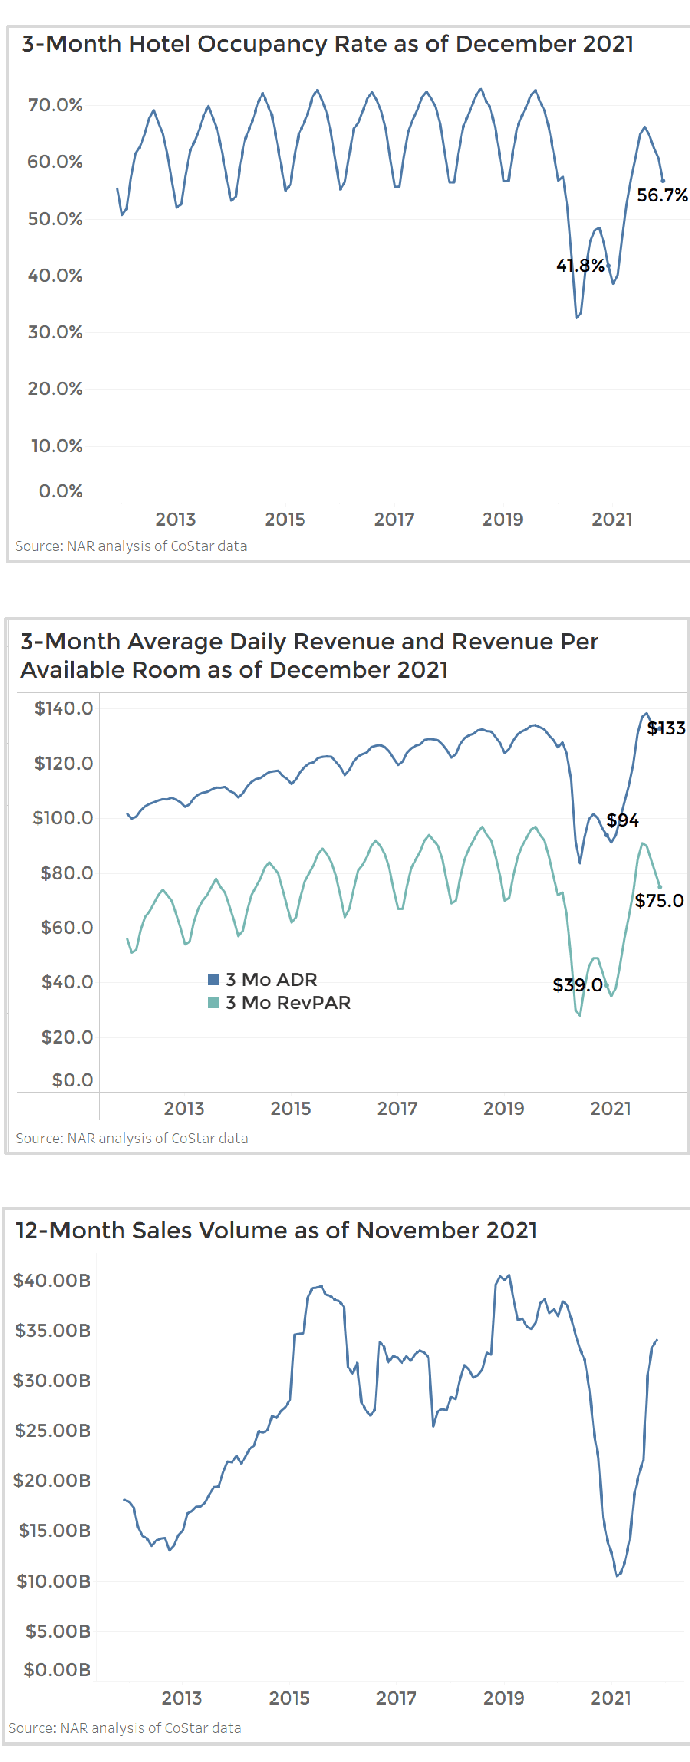
Hotel occupancy and revenues also recovered with increased personal and business travel. As of December, occupancy was at 57% compared to 42% one year ago.
Only the office sector continued to shed office space use, even with strong job recovery and with the continued decline in the fraction of workers working from home, to just 11% from 35% in May. Since 2022, 142.5 million square feet of office space has been given back to the market, pushing the vacancy rate up to 12.5%. However, most of the space given back is concentrated in the primary metro areas of New York, Los Angeles, San Francisco, Washington DC, Chicago, and Boston. Secondary/tertiary metros like Boise, Austin, and many Florida metro areas have absorbed office space since the pandemic.
2022 Outlook: Sustained Demand for Commercial Space and Investor Interest
NAR expects the demand for commercial real estate to strengthen in 2022, even with the broad uptick in interest rates as the Federal Reserve moves aggressively to rein back inflation towards 2% given the strong demand and supply fundamentals underlying the demand for commercial real estate.
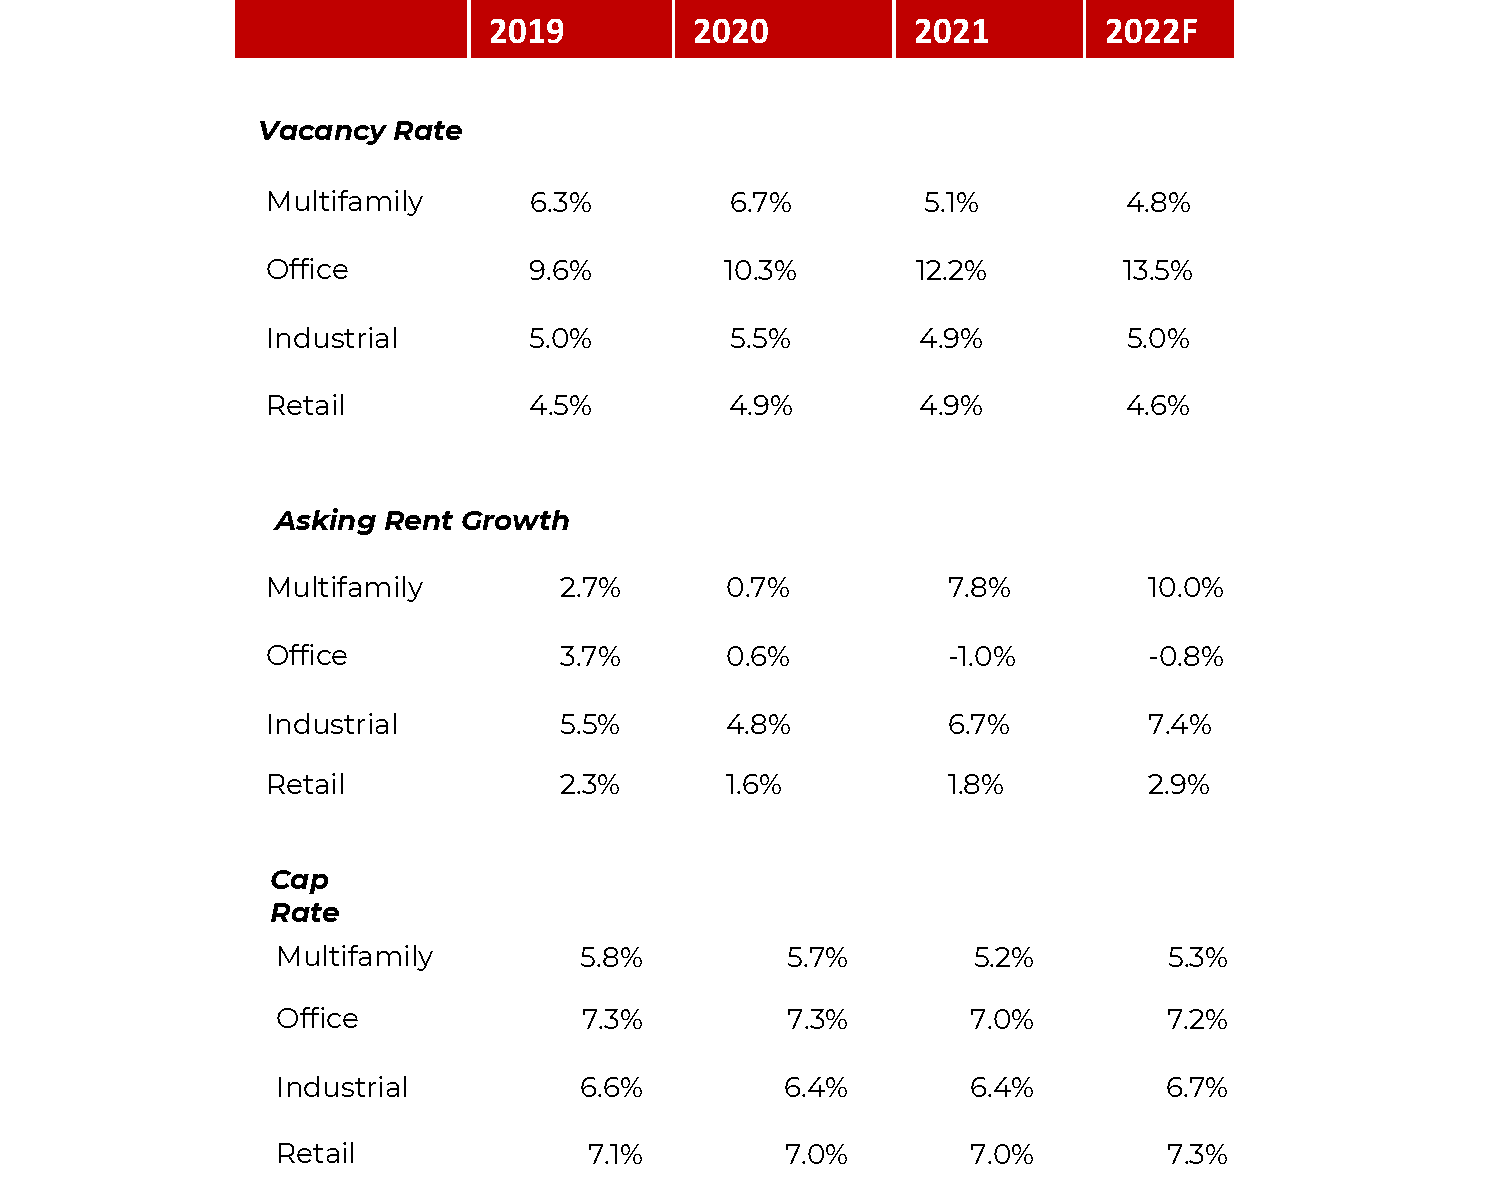
In the multifamily market, higher mortgage rates will boost rental demand as a mortgage payment becomes more slightly expensive. NAR forecasts that the vacancy rate will further tighten to 4.8% in 2022 (5.1% in 2021) and rent growth to average at 10% (7.8% in 2021). Renters have started returning to the primary metro areas, of New York, Chicago, Boston, Washington DC, Los Angeles, and San Francisco, in part attracted by the huge rent discounts during the pandemic. However, asking rents are picking up strongly which will tend to drive renters to less expensive secondary/tertiary markets or to outlying suburbs of these primary metro areas, especially with the opportunity to work from home. Rental demand is likely to continue to be strong in the West region and New England states where owning is more expensive than renting. Meanwhile, retiring baby boomers are likely to fuel demand in the Sunbelt markets, which will boost demand for commercial space (retail and small offices).
The office market will continue to see an increase in net absorption with more workers returning to the office, even if on a hybrid schedule. The fraction of the workforce working from home will likely continue to notch down to 10%. A major breakout of omicron variant cases still poses as downside risk to the office market’s recovery. Meanwhile, the ongoing construction that is equivalent to 2.6% of the current inventory will further raise the vacancy rate to 13.5% (12.2% in 2021) and cause a decline in office rent by 0.8% (-1% in 2021).
Demand for online shopping is likely to remain robust. While increased transmission of the omicron variant poses a downside risk for the office market, the converse is the case for the demand for industrial space, with consumers toggling between online and in-store shopping. With brick-and-mortars also moving to provide online shopping to complement in-store shopping, last-mile delivery services to consumers will continue to drive the demand for warehouses and distribution centers. About 460 million square feet of industrials space is under construction, or about 2.6% of the current inventory. NAR foresees that this construction will lead to slower industrial rent growth of 7.4% on an annual basis from the current rate of about 8.4% as of 2021 Q4 (6.7% in 2021). The vacancy rate is expected to slightly increase to 5% (4.9% in 2021).
In the retail brick-and-mortar market, growth will continue to be driven by smaller shops such as neighborhood centers, strip centers, and single-tenant stores. Although mall traffic saw a return to pre-pandemic levels mid-summer 2020, concerns in regards to the omicron variant and increases in Covid cases could hinder foot traffic moving forward. Consumer traffic is likely to become stronger in 2022 as malls continue to increasingly look towards experiential retail such as gaming lounges and kid activities to drive in-store traffic.
NAR Commercial Real Estate Outlook
Economic Conditions
Tightening labor market and rising inflation
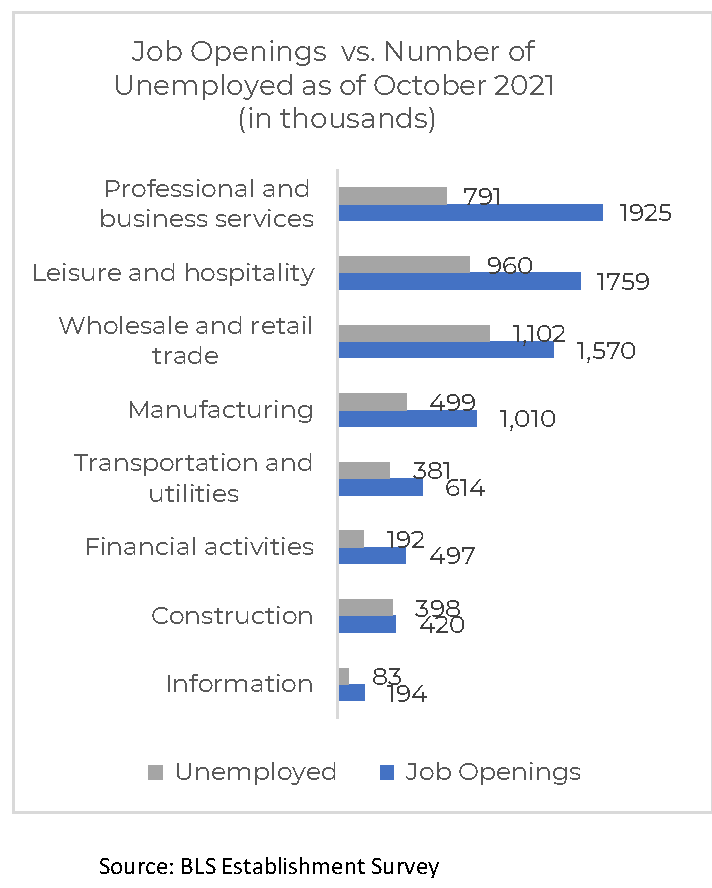
More job openings than job seekers with more people not in the labor force.
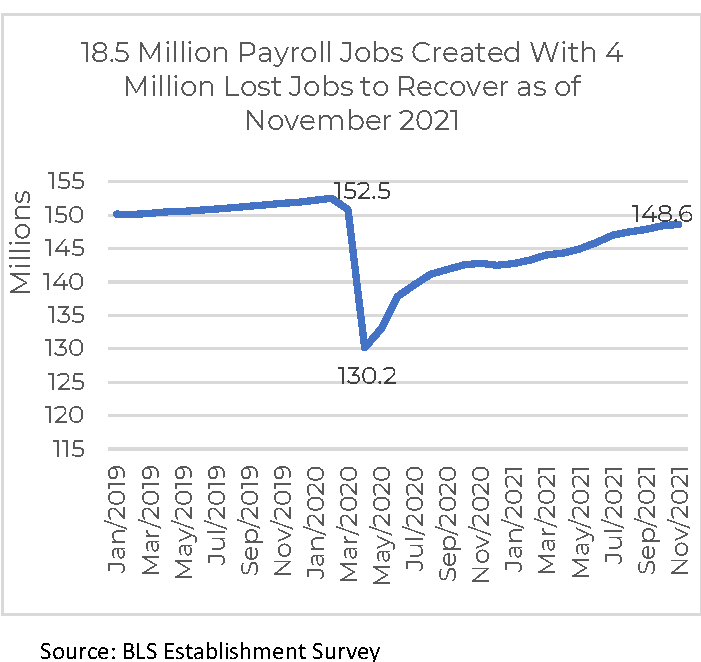
The economy continues to create net new jobs. As of November 2021, the economy has created 18.5 million net new jobs, or 83% of the 22.4 million jobs lost during March and April 2020. There are nearly 4 million nonfarm payroll jobs still to be recovered.
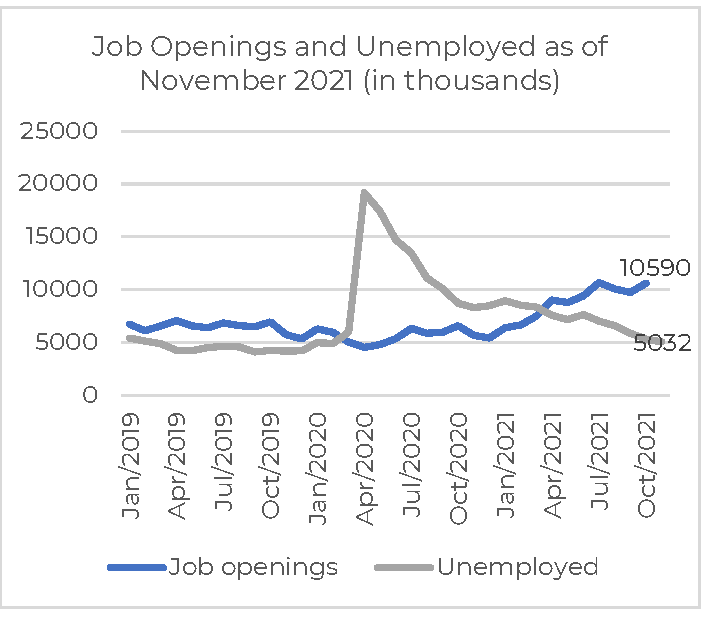
Yet even with 4 million jobs still to be recovered, labor is scarcer relative to the number of job openings. As of the end of October, there were 10.6 million job openings compared to just 5 million workers looking for jobs as of November, or 2 jobs openings per job seeker.
With tightening labor market conditions, the average weekly wage rose 4.8% from one year ago from 2.2% in May 2021. Wages could accelerate further with job openings outpacing the number of unemployed.
34% of 401 metro areas have higher employment as of November compared to February 2020
Out of 401 metro areas, 135 markets, or 34%, have more jobs as of November compared to February 2020. The job leaders are Salt Lake City, Provo-Orem, Tampa-St. Petersburg-Clearwater, Jacksonville, Fayetteville-Springdale-Rogers, San Antonio-New Braunfels, Kansas City, Baltimore City, Ogden-Clearfield, and Lakeland-Winter Haven, each with at least 10,000 net new jobs.
The gateway metro areas of New York-Newark-Jersey City, Los Angeles-Long-Beach-Anaheim, San Francisco-Oakland-Hayward, and Chicago-Naperville-Elgin have lost the most jobs, each at over 100,000.

Federal Reserve moves aggressively to control inflation.
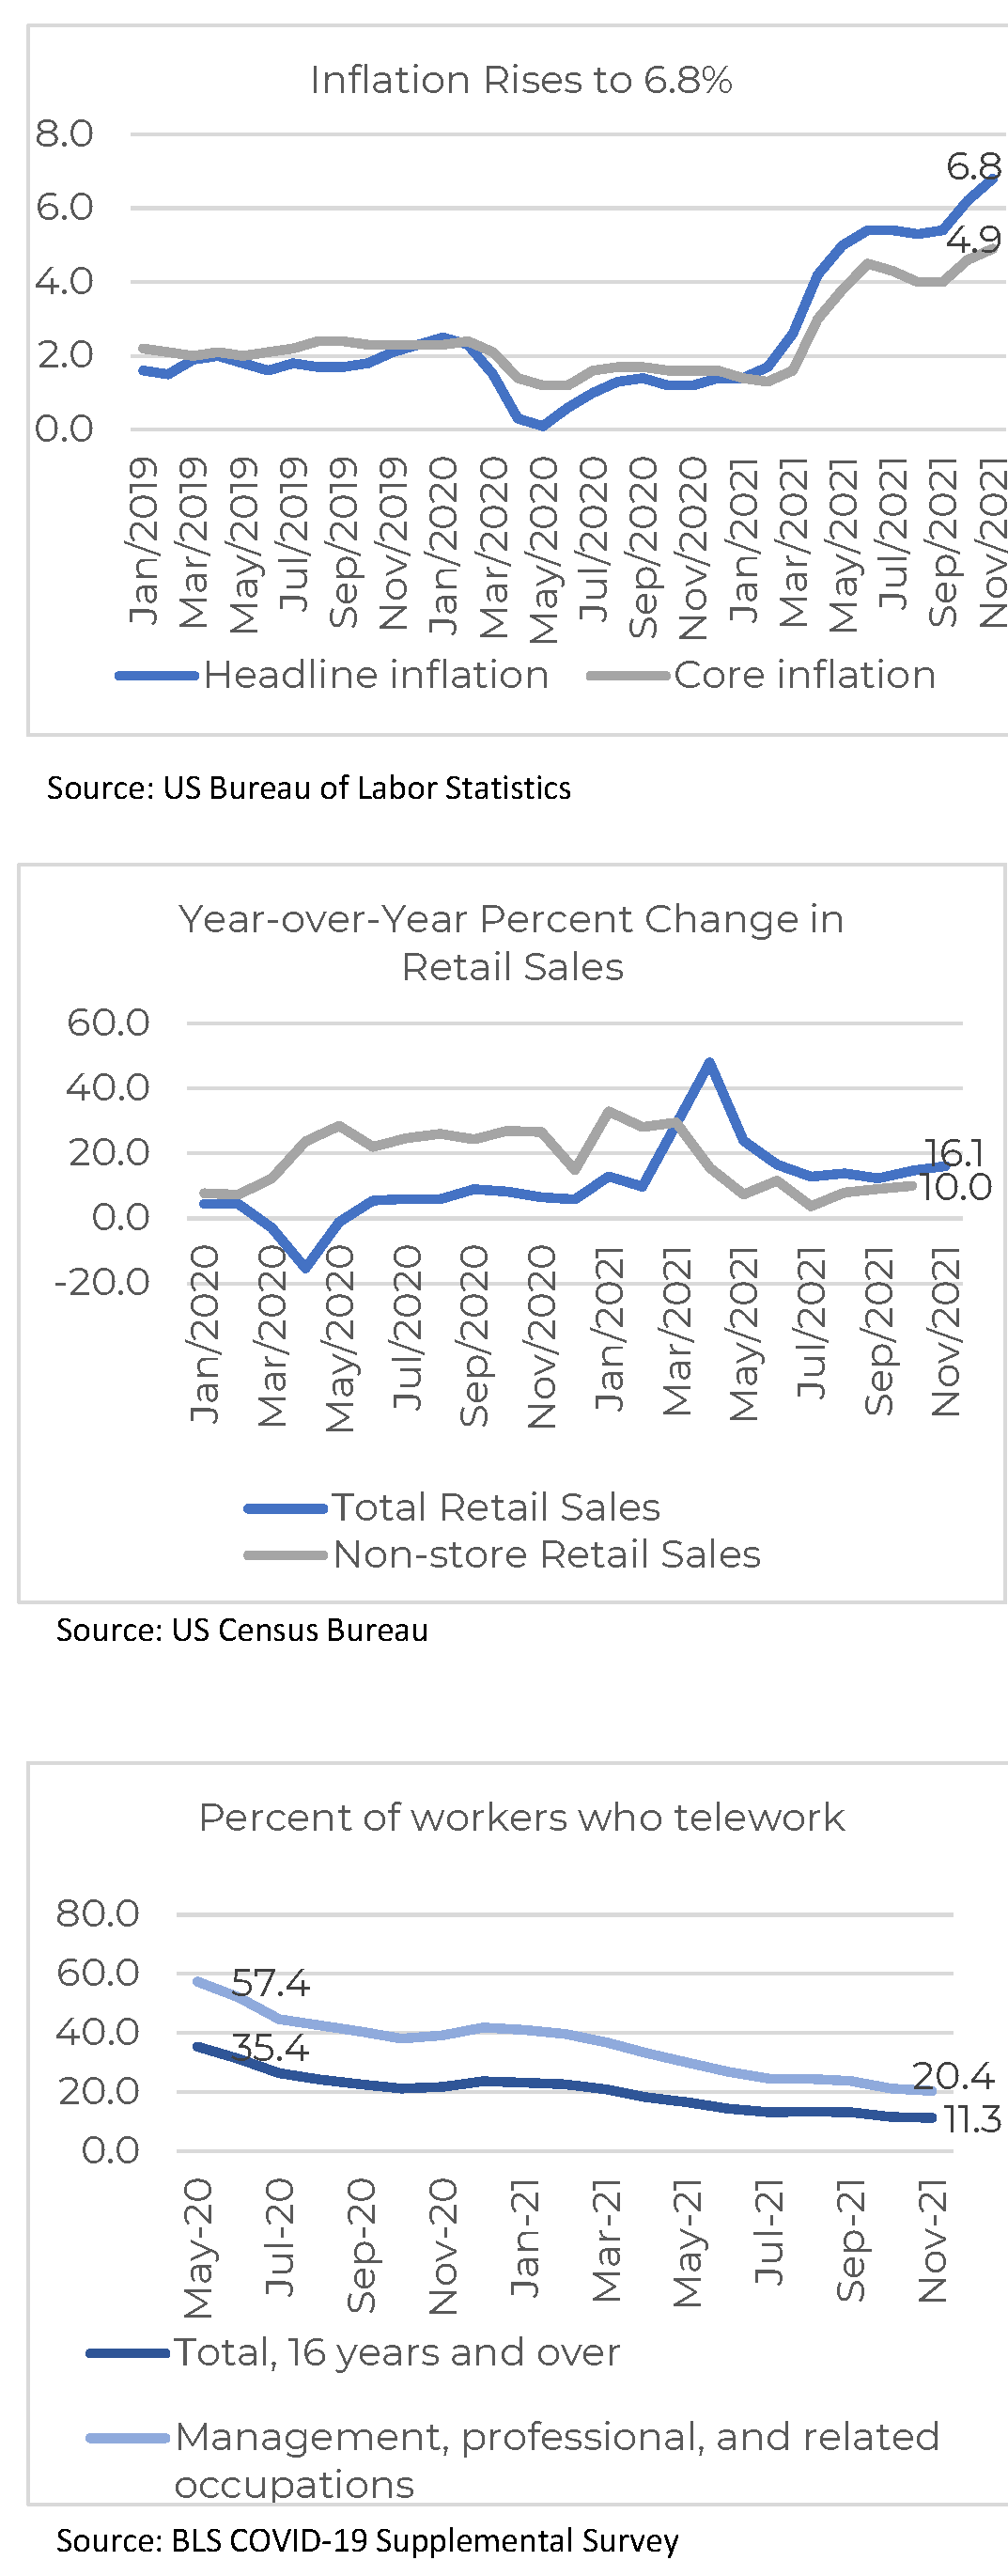
Inflation accelerated to 6.8% in November as core inflation (inflation excluding food and energy) also accelerated to 4.9%, indicating inflation is becoming persistent. In its December 15 meeting, the Federal Open Market Committee decided to wind down its $120 billion per month asset purchases by mid-March, with three potential rate hikes that will increase the federal funds rate to 0.9% by the end of 2022 (from the current 0% low-end rate) to keep inflation anchored at 2%.
Retail sales up 16% y/y in November
Consumer spending is strong, with the 12-month retail sales up 16.1% year-over-year in November 2021. Based on the detailed sales level for October, the strongest spending was at clothing stores, motor vehicle dealers, furniture stores, and miscellaneous item retailers. Non-store retail sales rose at a slower pace of 10.1% as of October and accounted for 17% of retail sales, slightly down from 18% in February 2021, an indication that brick-and-mortars are starting to regain some market share.
Continued decline in fraction of people working from home
Workers are returning to the office, with 11.3% of employed workers 16 years old and over teleworking, down from 35.4% in May 2020. Among management, professional, and related occupations, just 20.4% are teleworking, down from 57.4% in May 2020. As of November, 17.5 million people teleworked, up from 8.9 million in 2019 who worked from home, but down from 48.7 million in May 2020. With the rise in Delta variant and Omicron cases, tech, finance, and media companies such as Apple®, Alphabet®, Uber®, Lyft®, Blackstone, Carlyle, CNN, and NBC, have announced pushing back the return-to-work schedule.
Commercial Market Overview
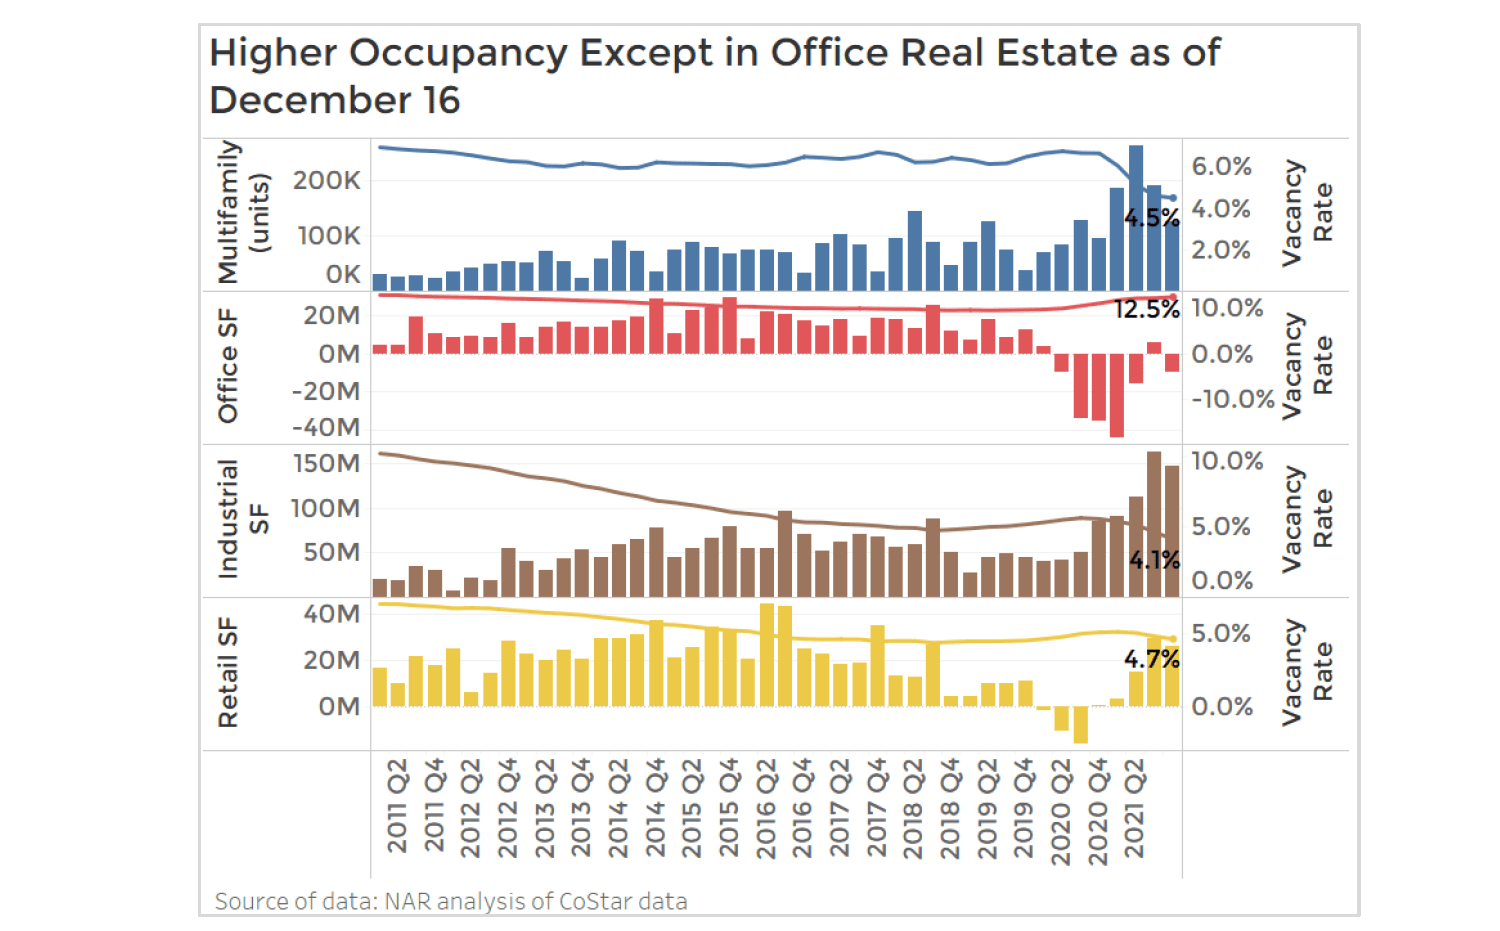
Rising occupancy except in the office market
In the three months ended December 18, occupancy rose in the multifamily, industrial, and retail sectors, but fell in the office sector as rising cases of the delta and omicron variant during the summer delayed the return to the office of many companies.
In the apartment market, 125,632 apartment units were absorbed in the past three months as of December 18, bringing the total net absorption to 1.07 million units during 2020 Q2 through December 18. With higher occupancy, the vacancy rate has declined to 4.6% from 6.7% in 2020 Q1. With strong demand, asking rents are up 11% year-over-year, the highest pace in a decade.
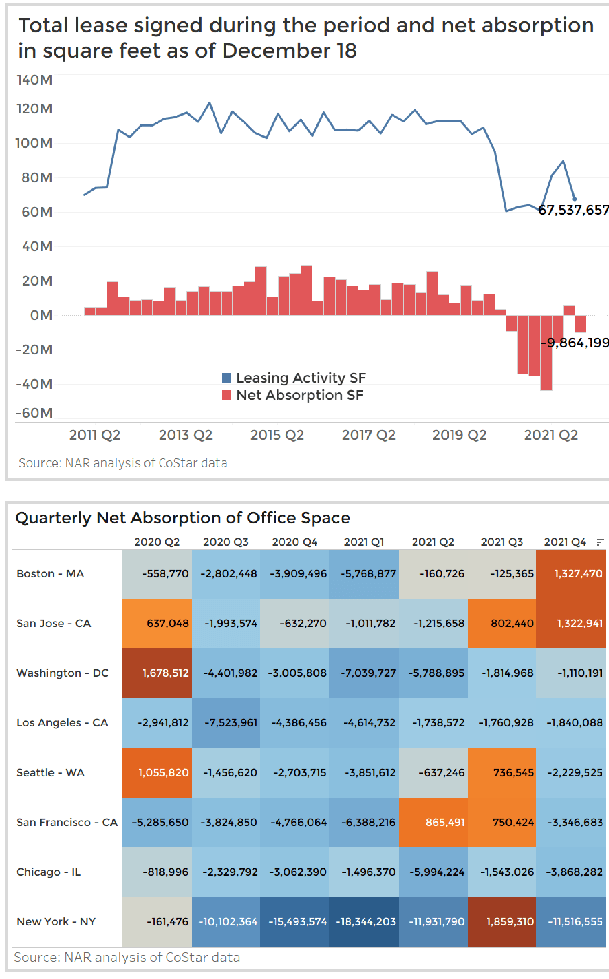
In the office market, occupancy fell 9.8 million square feet in the three months through December 18, with a total of 142.5 million square feet of office space given back to the market since 2020 Q2. The vacancy rate has increased to 12.5% from 9.8% in 2020 Q1. However, rents have stopped declining and are at par with the level one year ago.
In the industrial market, 149 million square feet of office space was absorbed in the past three months through December 18, with 696 million square feet of space absorbed from 2020 Q2. The industrial sector has the lowest vacancy rate among the core property markets, at 4.1%, from 5.3% in 2020 Q1. Rents are up 8.4% year-over-year.
In the retail property market, occupancy has been rising since 2020 Q4, with 26 million square feet absorbed in the past three months ended December 18, and a net absorption of 47.9 million square feet since 2020 Q2. The vacancy rate is at 4.7%, Rents are also rising at 2.8% year-over-year.
Rising investor acquisitions and falling cap rates
With improving market fundamentals, investor acquisitions for multifamily, office, retail, and industrial properties totaled $523 billion in the four ten months of the year on acquisitions $2.5 million or over, according to Real Capital Analytics, and is poised to surpass the level of acquisitions in 2006 of $581 billion.
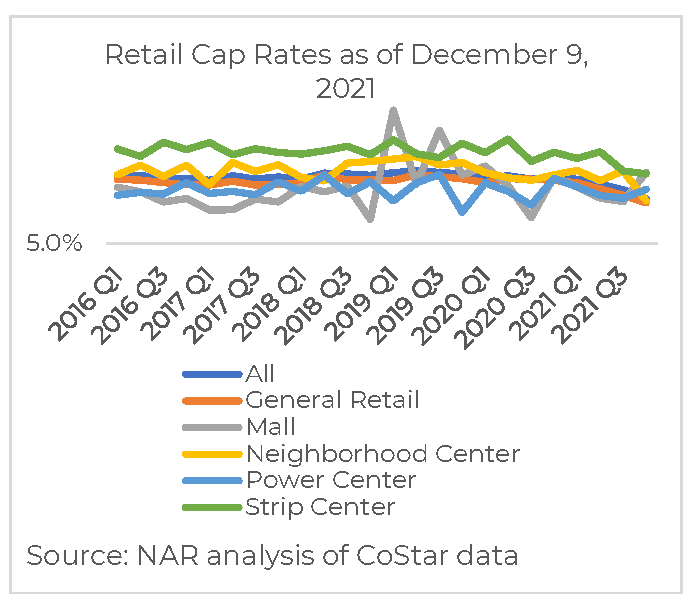
With strong investor demand, cap rents continued to trend down. As of December 18, the lowest median cap rate was of multifamily properties (4.9%) while the highest cap rate was of retail properties (7%). Cap rates have trended downwards compared to pre-pandemic levels even for office properties and even as 10-year Treasury yields have trended upwards to 1.6% as of November 2021 from 0.9% in March 2020.
Construction activity has ramped up for industrial properties, with 460.9 million square feet under construction, equivalent to 2.6% of the current inventory of industrial space. Rising construction should ease the tightening vacancy rate in the industrial property market and temper rent growth. However, the number of apartment units under construction has declined to 702,259 as of the third quarter, which is running below the 735,035 units under construction prior to the pandemic. The number of units under construction is also running below the 12-month absorption of demand of 764,788 so rental vacancy rates are likely to remain tight in 2022.
Multifamily
Absorption of apartment units rise to highest level in a decade
Net absorption of apartment units reached its strongest level in a decade, with a net absorption of 1.07 million units since 2020 Q2. Absorption in the past 12 months totaled 764,788 units.
Occupancy is rising across primary and secondary/tertiary markets, with the largest increase in occupancy in Dallas-Fort Worth, New York, Houston, Los Angeles, Washington, DC, Chicago, and Austin each a net absorption of over 25,000 apartment units in the past 12 months as of December 18, 2021. Most metro areas experiencing the highest net absorption are in the Sunbelt states.
A third of metros have double-digit rent growth
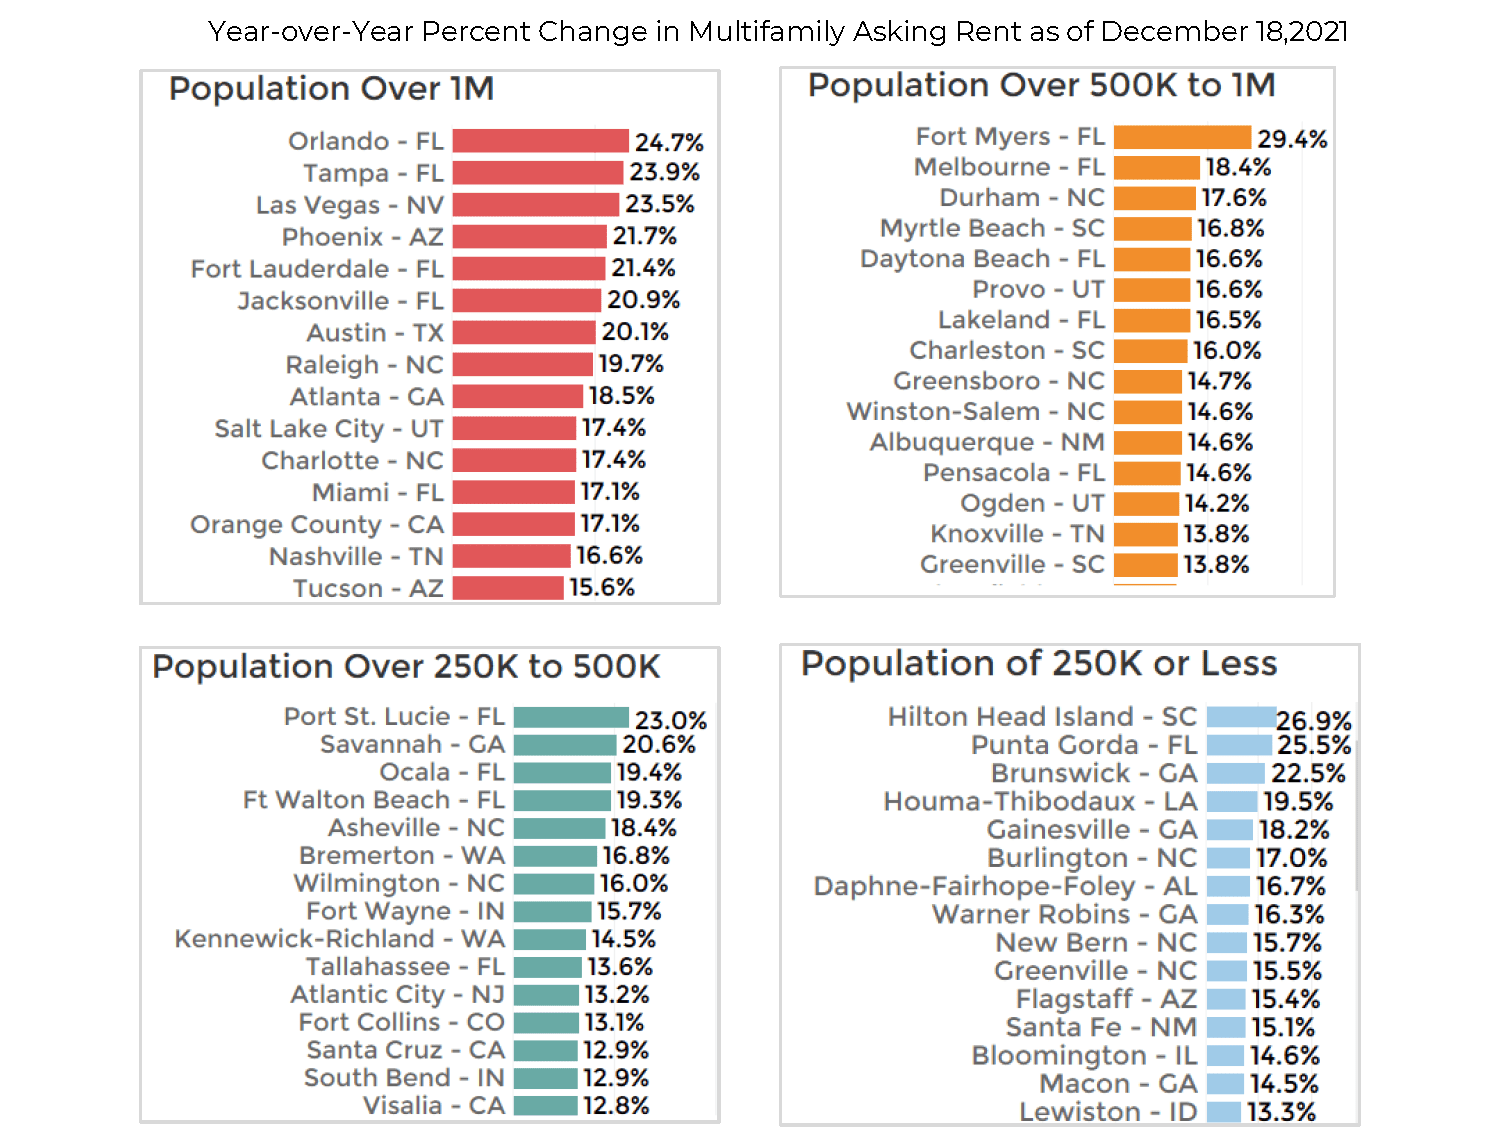
The average asking rent across 390 markets rose 11% year-over-year as of December 18. Across the most population to least populous metro areas, Florida metro areas had the highest rent growth in the areas of Orlando, Tampa, Fort Myers, Port St. Lucie, Punta Gorda, and Fort Lauderdale, with asking rents up at least 20% year-over-year. Metro areas in the South region are experiencing the fastest rent growth, mainly metro areas in Florida, Texas, Nevada, Arizona, Texas, North Carolina, South Carolina, New Mexico, Georgia, Louisiana, and Alabama. In the West region, rents are rising fast in the some metro areas of California, Nevada, Utah, and Washington. Rising rents signals a need for more rental housing construction in these markets.
Apartment construction boom in Sunbelt and Mountain metros
As of 2021 Q3, there were about 700,000 apartment units under construction in 390 markets tracked by CoStar, which is equivalent to 4% of the total stock of apartment units. This is about on par with the annual absorption of 765,000 units, so the additional construction will just be adequate to meet demand, and not significantly increase vacancy rates.
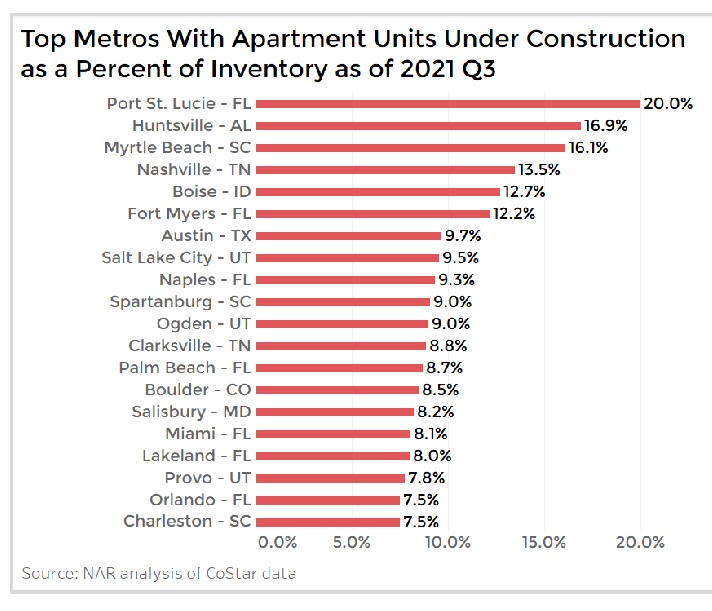
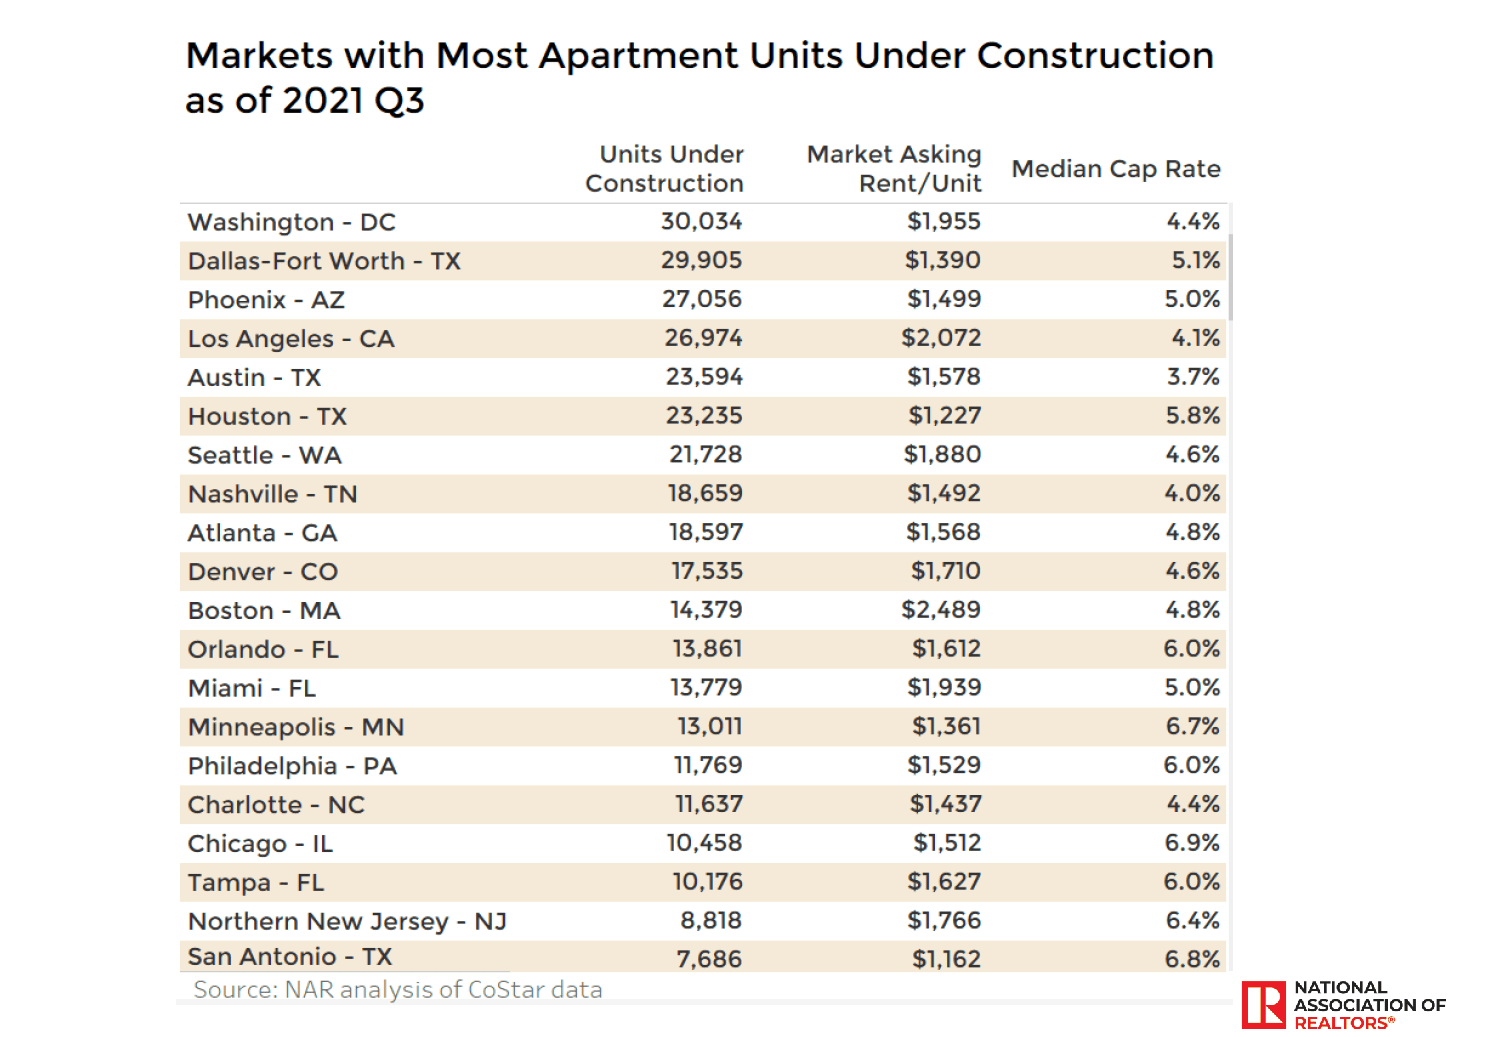
Among metro areas with a population of at least 250,000 Washington DC has the most units under construction, at about 30,000 units, followed by Dallas-Forth Worth, Phoenix, Los Angeles, Austin, Houston, and Seattle, each with at least 20,000 units under construction. However, as a percent of the existing stock, construction activity was most intense in the Sunbelt and Mountain areas led by Port St. Lucie (20% of stock), Huntsville (16.9%), Myrtle Beach (16%), Nashville (14%), Boise (13%), and Fort Myers (12%).
Office
Occupancy and leasing declines in 2021 Q4
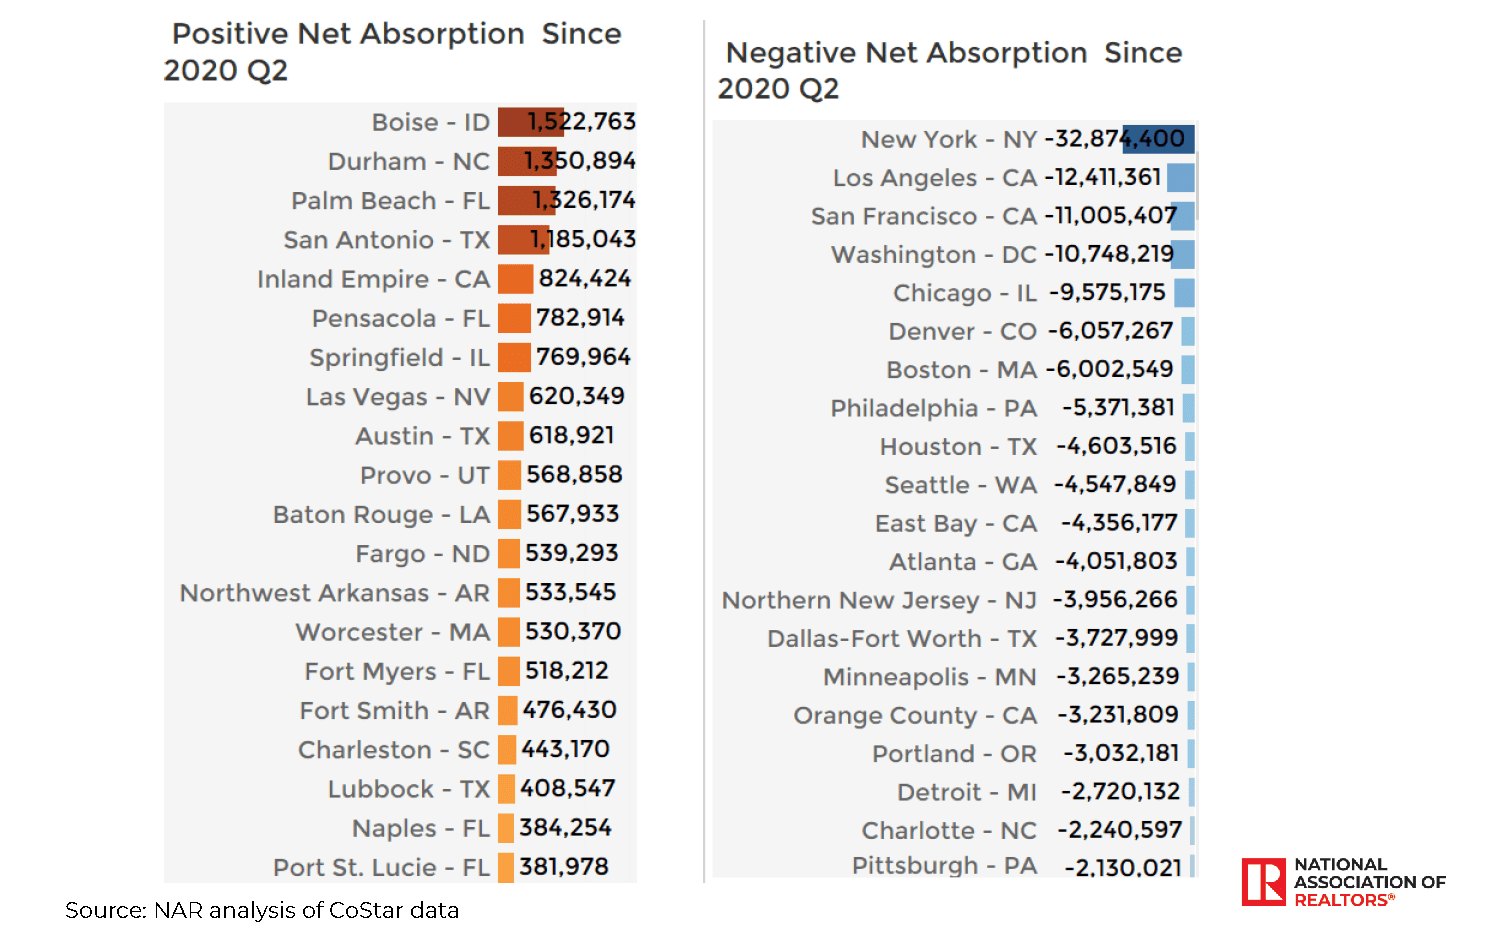
The office market has yet to have a solid consistent recovery. After 5.6 million sq. ft. was absorbed in the third quarter, occupancy fell by 9.8 million square feet in the fourth quarter. Since 2020 Q2, office occupancy is still down on a net basis by 142.4 million square feet, with the largest losses in the primary metro areas of New York, Los Angeles, San Francisco, Washington DC, Chicago, and Boston. On the other hand, secondary markets Boise, Durham, Palm Beach and San Antonio each had positive absorption of at least 1 million square feet.
Total leasing volume fell to 67.5 million square feet, and that is about half of the pre-pandemic level. The surge in Delta variant cases during the July through September and the emergence of the omicron variant in November has pushed back the return to work schedules of companies, including major tech companies like Apple®, Google® Facebook®, and Salesforce®.
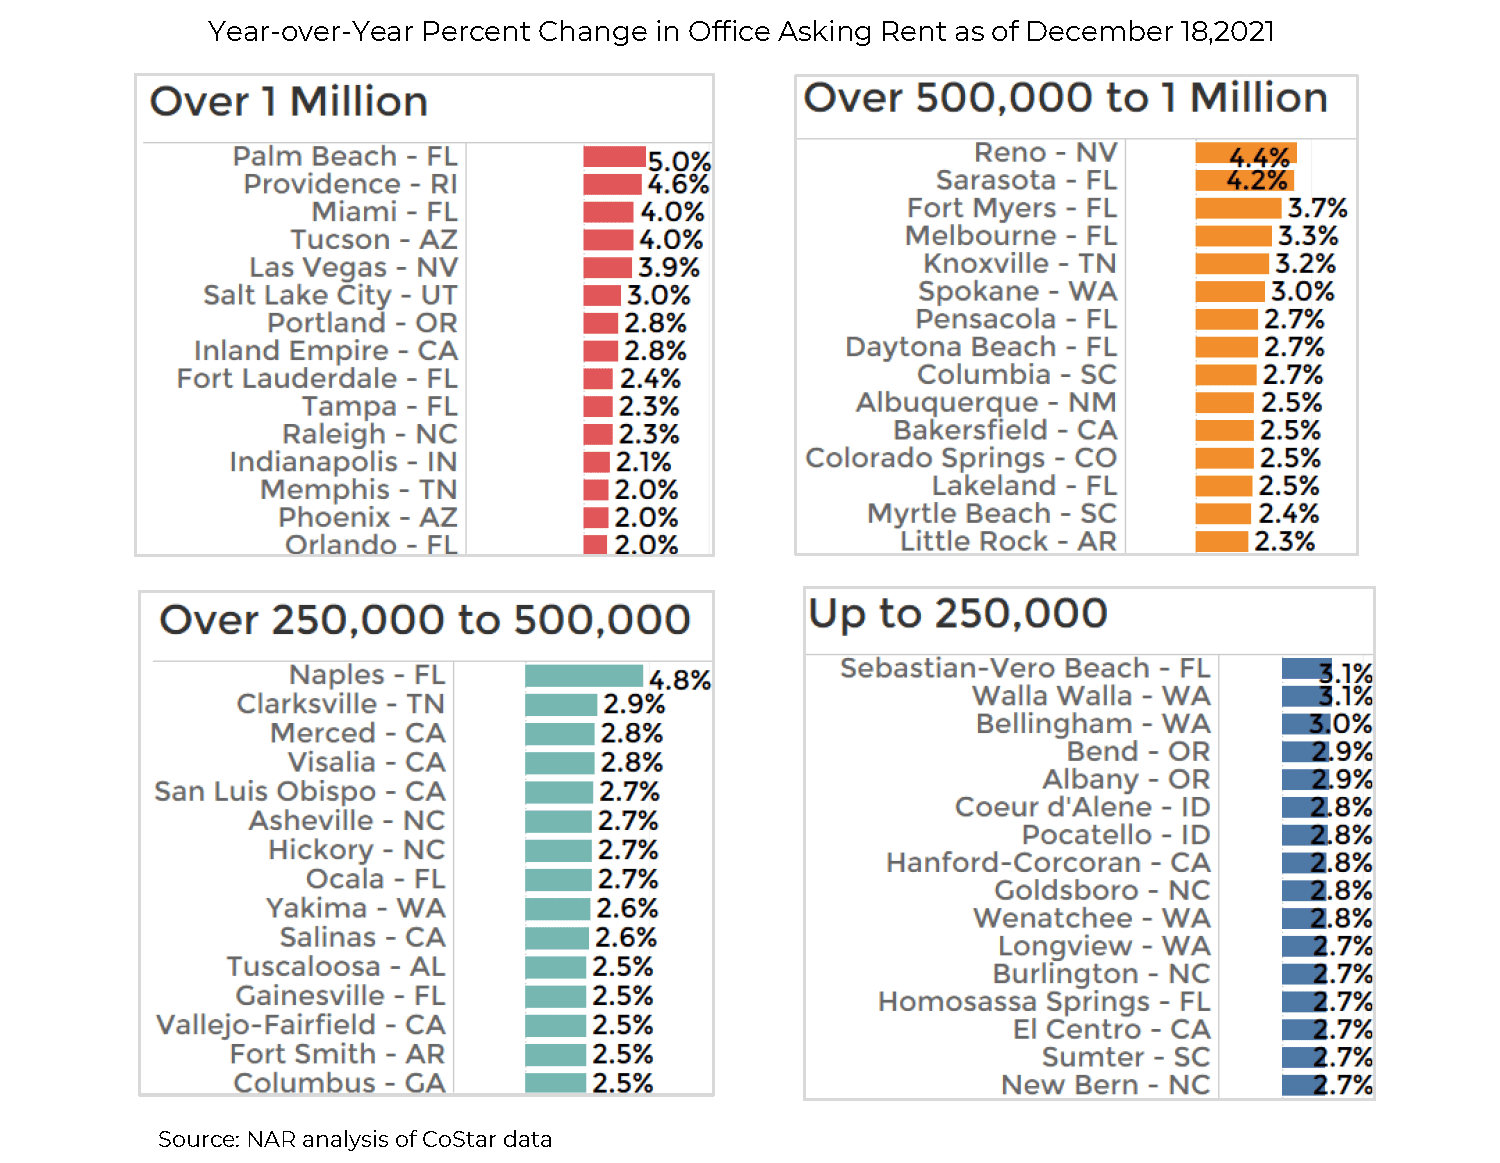
Florida is hottest office market
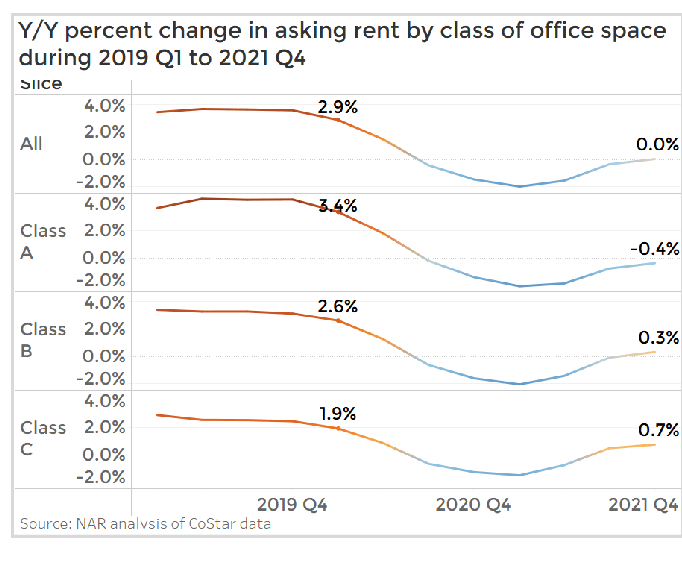
Office asking rents continue to decline for Class A office properties (-0.4%), but are rents are rising for Class B/C properties. Of 390 market areas tracked by CoStar, office rents are still declining as of December 18 on a year-over-year basis in 13 markets, including San Francisco (-4%), New York (-2%), Washington DC (-0.7%), Chicago (-0.1%), East Bay (-1.3%), and Orange County (-0.9%).
Florida has seven of the eleven top metro areas with the fastest rent growth, with rent up at least 3% year-over-year: Palm Beach, Miami, Sarasota, Fort Myers, Naples, and Melbourne.
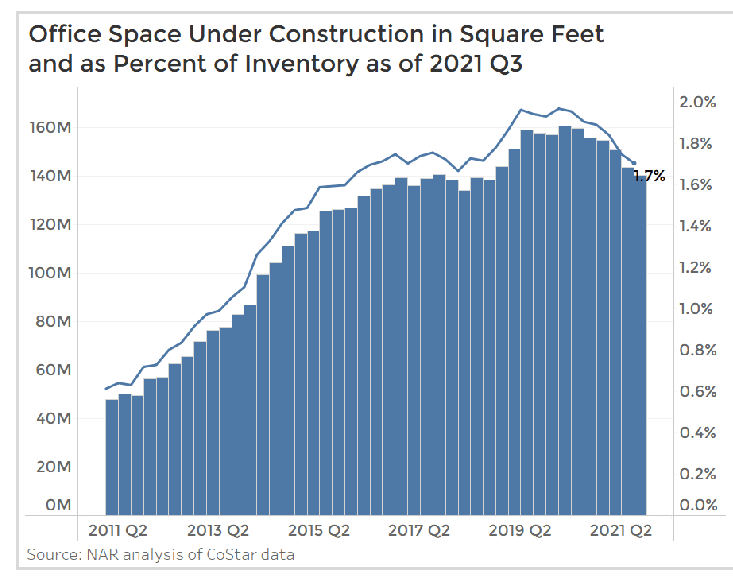
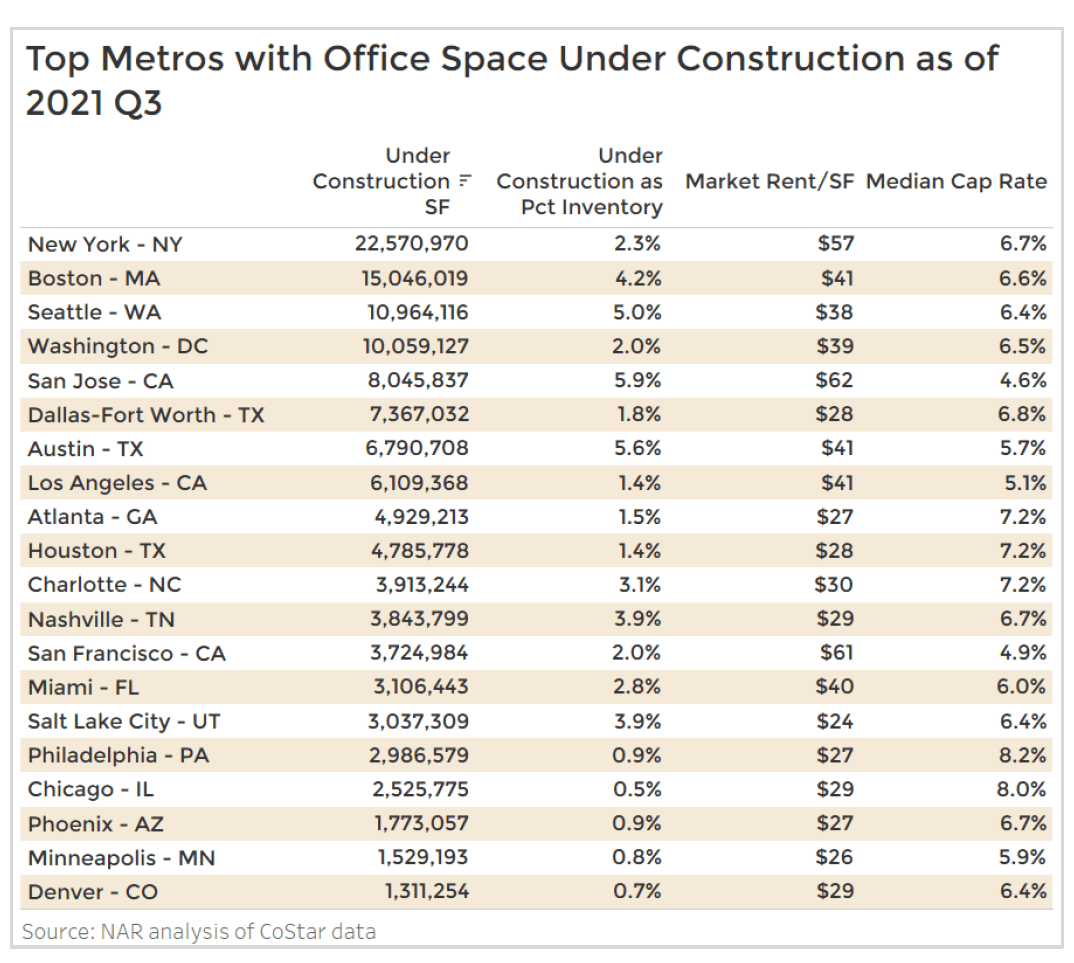
Office construction to hold down rent growth
As of 2021 Q3, 140 million square feet is under construction, equivalent to 1.7% of the current inventory of office space. With 145 million of office space given back to the market since the pandemic, the construction underway will add to the current vacant space and will keep a lid on rent growth.
Among metro areas with a population of at least 250,000, the largest office construction activity is in the New York metro areas, followed by Boston, Seattle, and Washington DC, each with at least 10 million square feet under construction.
As a percent of office inventory, the construction activity is most intense in the tech metros of San Jose (5.9% of inventory), Austin (5.6%), Seattle (5%), Boston (4.2%), Salt Lake (3.9%), Nashville (3.9%), and Charlotte (3.1%). The average market rent per square foot in these markets is about $20 to $30 cheaper compared to San Francisco and San Jose, which generates significant savings in office rents for tech companies setting up in these markets.
Industrial
Strong demand and low vacancy continue to push up asking rents
Robust demand for industrial space coupled with decreasing vacancy rates continue to push asking rents up as supply remains limited in comparison to demand. Record net absorption was achieved in Q3 at 166 million square feet (msf) and as of Q4 2021 net absorption totals 143 million as demand remains elevated.
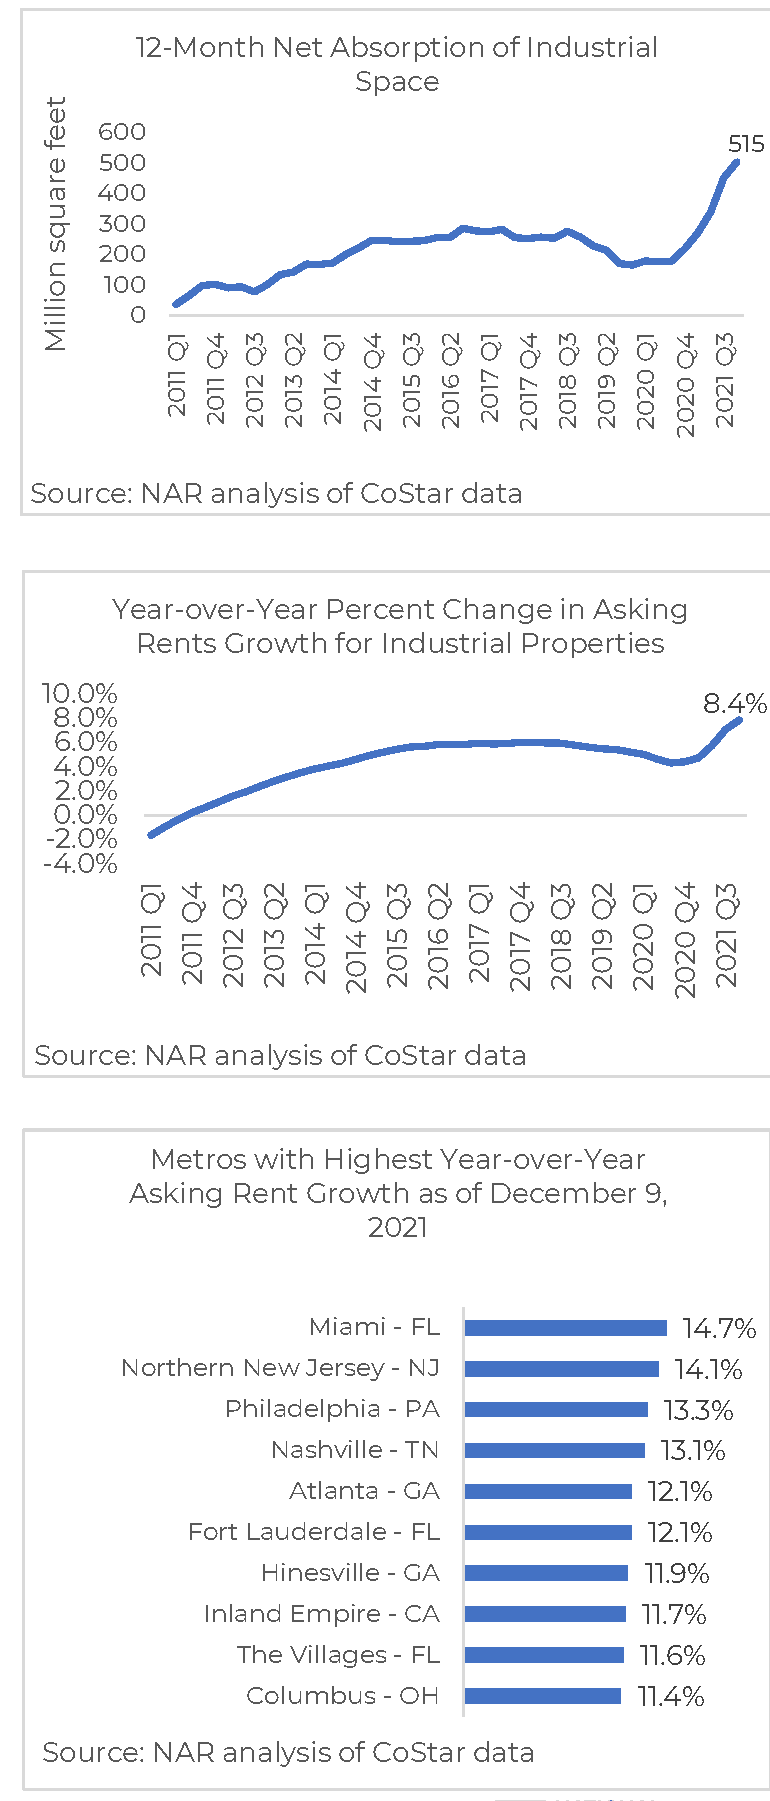
In regards to 12-month net absorption, net absorption reached 515 msf as of Q4 December 9, 2021.
With such high demand supply has not been able to keep up as deliveries total 59 msf in Q4 2021. It is worth noting that deliveries have been picking up each quarter across 2021 despite inflation, labor issues and material costs and availability.12-month deliveries lag 12-month net absorption as well, totaling 278 msf.
Industrial space under construction totaled 465 msf in Q3 2021 and despite this, increased demand for new industrial space will keep the availability rate low where it is currently 7.0%.
Logistic space makes up a significant portion of industrial space absorbed as 12-month net absorption totaled 467 msf in Q4 and makes up 90% of all industrial net absorption.
As of December 9, 2021, the leaders in industrial markets by net absorption were Dallas (48 msf), Atlanta (36 msf), Inland Empire (32 msf), Chicago (32 msf) and Houston (30 msf).
On average, asking rents were up in all 390 metros covered by CoStar. Asking rents saw a sharp increase and a new high of 8.4% year-over-year in Q4.
The leading metro areas with the highest rent growth were Miami, FL (14.7%), Northern New Jersey (14.1%), Philadelphia, PA (13.3%), Nashville, TN (13.1%) and Atlanta, GA (12.1%).
Logistic space remains the primary driver of industrial space
As of December 9, 2021, total sales volume of industrial properties totaled $19.9 billion thus far in Q4 2021 where flex totaled ($3.5 billion), logistics ($12.7 billion) and specialized ($3.6 billion).
Industrial sales total $89.7 billion year-to-date (ytd), with sales totaling $15.8 billion for flex, logistics ($58 billion) and specialized ($15.7 billion) through ytd according to CoStar® data as industrial sales continue growth across the entire year.
The majority of all industrial sales volume is comprised of logistic sales at 65% in Q4 as of December 9 despite declining availability. YTD through Q4 2021, of the $89.7 billion all industrial sales volume, logistic sales made up 64% with tight market conditions fueled by increases in digital sales as consumers expect to receive their goods quickly.
The average sales price per square foot for industrial properties rose to $130, up from $125 in Q3. Flex space has the highest average sales price per square foot at $197 followed by logistics space ($124) and specialized ($116).
Overall industrial cap rates decreased 10 basis points in Q4 as of December 9 from Q3. Cap rates averaged 6.2% for all of industrial where cap rates increased in both flex and specialized and decreased in logistics space. Cap rates were highest in Flex at 7.1%, 6.1% for specialized acquisitions and lowest in Logistics, 6.0%.

Retail total sales volume reach $66.2 billion year-to-date
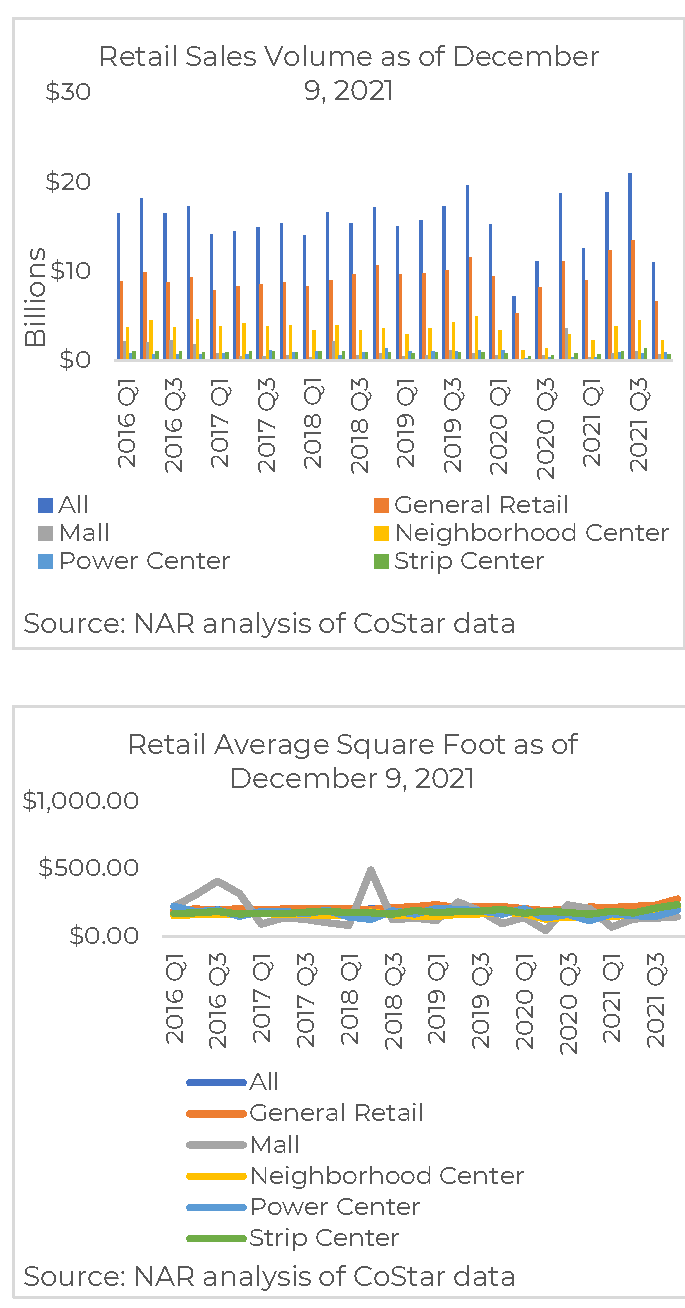
As of December 9, 2021, total sales volume of retail assets totaled $13.7 billion thus far in Q4 2021 and totaled $66.2 billion year-to-date (ytd), with sales totaling $8.1 billion for general retail, mall ($794 million), neighborhood centers ($2.9 billion), power centers ($1 billion) and strip centers ($782 million) in Q4 according to CoStar® data.
General retail sales make up the majority of all retail sales as this assets sales volume totals 60% of all retail sales in Q4 as of December 9. YTD through Q4 2021, of the $66.2 billion all retail sales volume, general retail sales share was 65%, malls (4.2%), neighborhood centers (20.2%), power centers (4.5%) and strip centers (5.7%).
The average sales price per square foot for retail properties increased to $225 as of December 9, up from $222 in Q3. All retail assets saw an increase in the average sales price per square foot where the highest price per square foot is reserved for general retail at $241.
Overall retail cap rates decreased in Q4 as of December 9 from Q3 by 20 basis points. Cap rates averaged 6.2% for all of retail where the majority of retail asset cap rates decreased. General retail, neighborhood center, and strip center saw declines in cap rates from Q3 to 6.1%, 6.2% and 6.7% respectively, while malls and power centers increased to 6.7% and 6.5%.

Demand for retail properties, especially general retail, continue upward trend
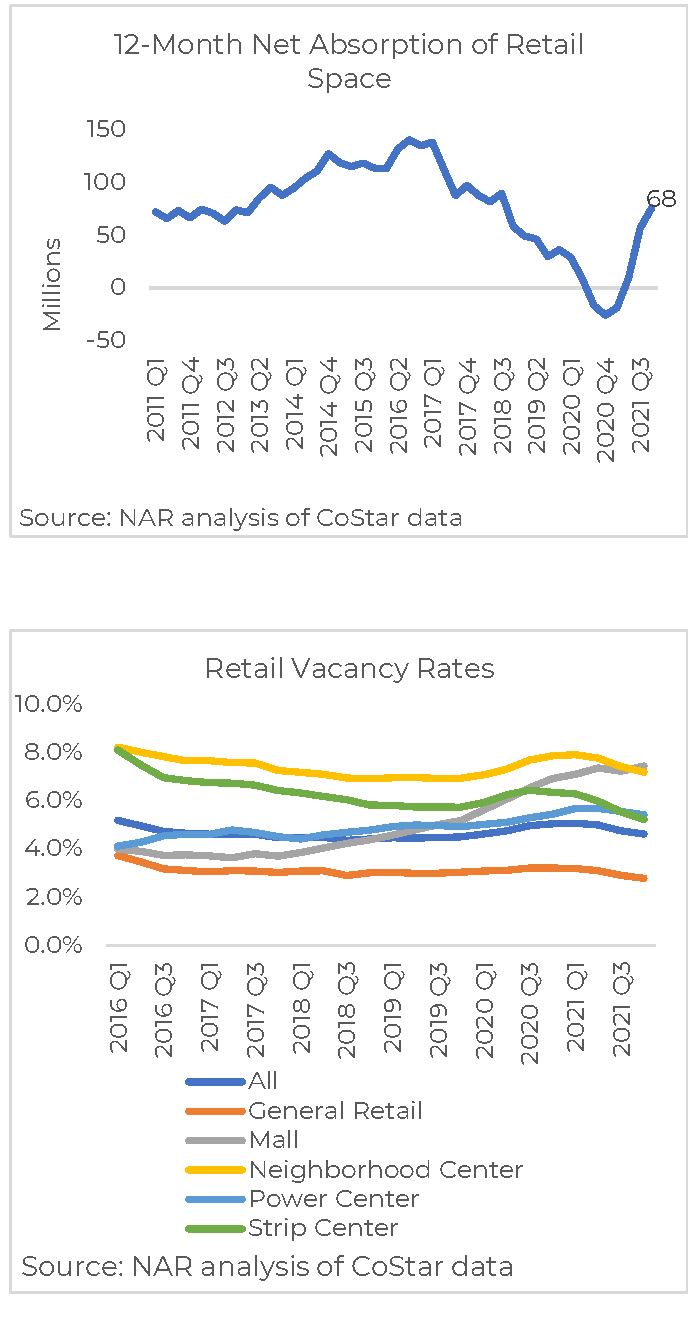
Net absorption of retail space in the past 12 months as of December 9, 2021 was 68 msf. Q4’s most recent data is up from the 50 msf recorded in the prior quarter.
Of the 68 msf net absorption of retail space, the majority is for general retail (60%) space. All retail assets saw positive net absorption except for malls which saw -7.7 msf of negative net absorption. Q3 2018 was the last time malls saw positive 12-month net absorption where it totaled 2 msf .
According to CoStar® data, of the metros with positive absorption, the top markets by 12-month net absorption were Houston-TX (5.3 msf), Atlanta-GA (4.1 msf), Dallas-Fort Worth-TX (3.6 msf), Chicago-Il (2.8 msf), New York-NY (2.3 msf) and Inland Empire-CA (2.3 msf), while negative net absorption was led by to by East Bay-CA (-600,450), Knoxville-TN (-372,324), Washington D.C. (-370,514) and Wausau-WI (-333,780).
Retail vacancy rate continued its downward trend as of December 9, 2021 to 4.7% and down 10 basis points from Q3. The mall vacancy rate was the only retail property type with an increase in vacancy rate in Q4, a 0.4% increase from Q3 to 8.4%. Mall vacancy rates are the highest among all retail assets.
On average, as of December 9, 2021, asking rents were up 2.7%. Of the 390 metro areas covered, positive year-over-year growth in asking rents was led by Akron-OH (10.0%), Las Vegas-NV (8.8%), Tulsa-OK (8.3%), Salt Lake City-UT (8.0%) and Fort Lauderdale-FL (8.0%)%. Markets that saw negative rent growth were San Francisco-CA (-5.2%), New Haven-CT (-2.4%) and Saint Louis-MO (-1.7%).
Hotel
Rising occupancy and revenues as travel resumes
With the progress on vaccination and the uptick in business and personal travel, hotel occupancy improved to 56.7% during the 3-month period as of December 18, 2021 compared to the 3-month occupancy rate of 42% one year ago. The hotel industry’s revenue metrics―average daily rate (ADR) and revenue per available room (RevPAR) ― also improved in the past three months ended December 18 compared to one year ago. RevPAR rose to $75, or double the $39/room rate one year ago while the ADR rose to $133 from $94 one year ago. Sales over a 12-month period have also picked up, increasing to $34 billion as of December, from a low of $10 billion in February 2021. Cap rates have also decreased to 8.6% from 8.8% in February 2020, an indication that hotel property values are firming up.
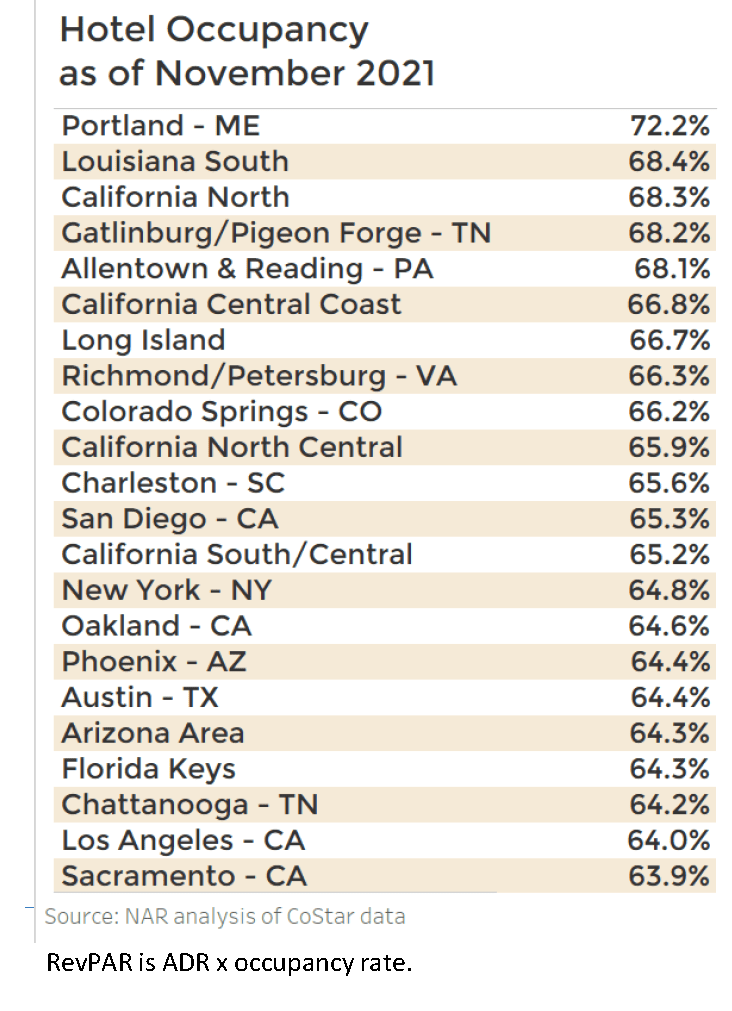
The highest occupancy rates are in Portland (Maine), Southern Louisiana, California North, Gatlinburg, and Allentown/Reading.
LAWRENCE YUN, PhD
Chief Economist & Senior Vice President for Research
GAY CORORATON
Senior Economist & Director of Housing and Commercial Research
BRANDON HARDIN
Research Economist
MEREDITH DUNN
Research Manager
Download report here: download pdf
Download other NAR Commercial reports at Commercial Research
©2021 National Association of REALTORS®
All Rights Reserved. May not be reprinted in whole or in part without permission of the National Association of REALTORS®.
For question about this report or reprint information, contact [email protected].